
Featuring curated, consistently profitable traders from the Binance Leaderboard.
We'll reveal key stats and insights that distinguish top traders in this competitive arena.
Let's explore the trading elites! 💪
1️⃣ Top 3 Traders by PnL ($) - Overview#
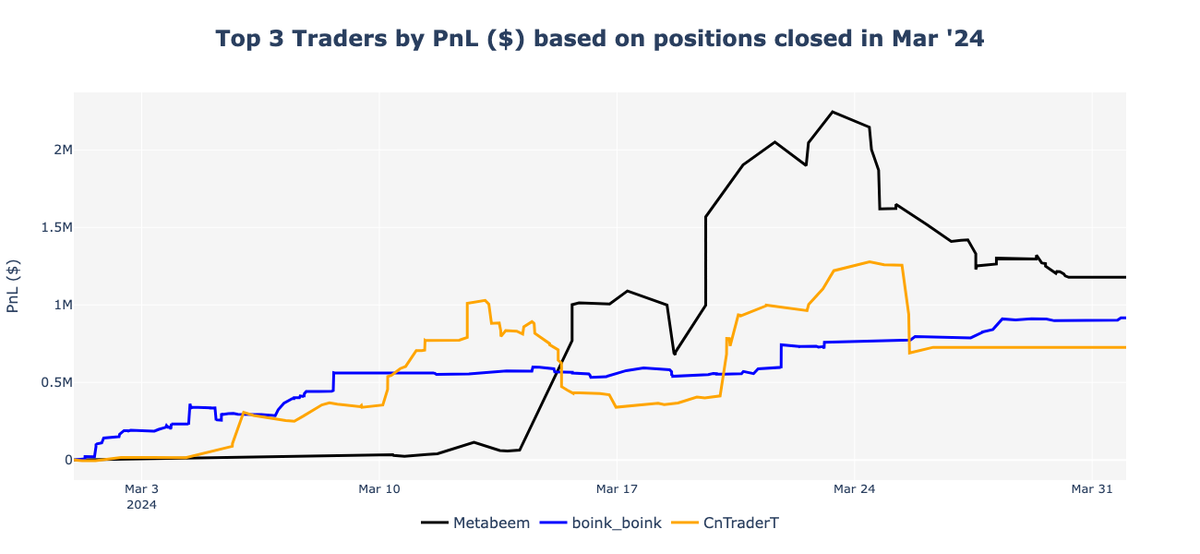
March 2024 highlights its top three traders as follows:
🏆 Metabeem
🥉 CnTraderT (ApexTraderAlex)
In March, Bitcoin experienced a significant increase, closing the month up +16.6% and reaching a new all-time high. This remarkable performance came despite a notable dip in value of almost 16% around the middle of the month.
Our top traders of the month achieved impressive profits ranging from $727k to $1.1mln.
At the forefront this month was Metabeem, who garnered an impressive profit of $1.1 million. Hot on his heels in second place is boink_boink, a trader we've previously mentioned in our reports, who concluded the month with earnings of $917k. Rounding out the top three is CnTraderT, finishing the month with gains of $727k.
From the PnL curves, it's evident that Metabeem experienced the most significant increase in PnL, peaking at $2.2 mln in profit before giving back half by month's end. boink_boink showcased the most consistent PnL curve, steadily ascending with minimal fluctuation. Similar to Metabeem, CnTraderT's PnL curve was more turbulent, distinctly displaying higher highs and lower lows throughout the month.
2️⃣ Top 3 Traders - Performance Metrics and Profiles#
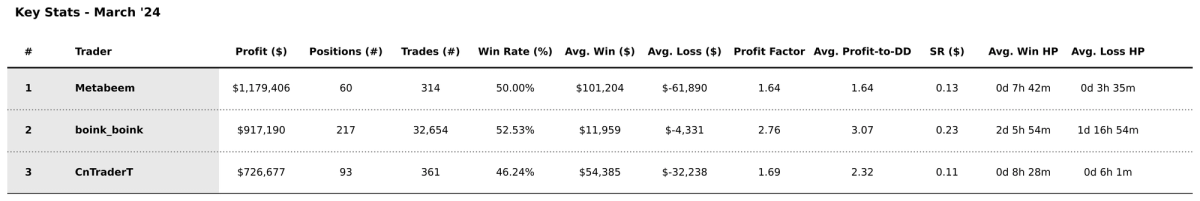
Metabeem closed a total of 60 positions, achieving a Win Rate of 50% and a Profit Factor of 1.64. His trading strategy is characterized by short holding periods, with positions typically closing between 3 and 8 hours.
boink_boink demonstrated remarkable trading activity, closing an impressive 217 positions and securing the highest Win Rate among the trio at 52.5%. He stands out with the highest Profit Factor of 2.76 and the best average Profit-to-Drawdown ratio of 3.07, highlighting his efficiency in managing risk versus reward. Furthermore, boink_boink maintained the longest average holding period, ranging from 1 to 2 days.
CnTraderT, on the other hand, executed 93 trades, registering a Win Rate of 46.2%. Like Metabeem, his average holding period falls within the intraday range. CnTraderT achieved a Profit Factor of 1.69 and an average profit-to-drawdown ratio of 2.32.
3️⃣ Trader Spotlight: Metabeem#
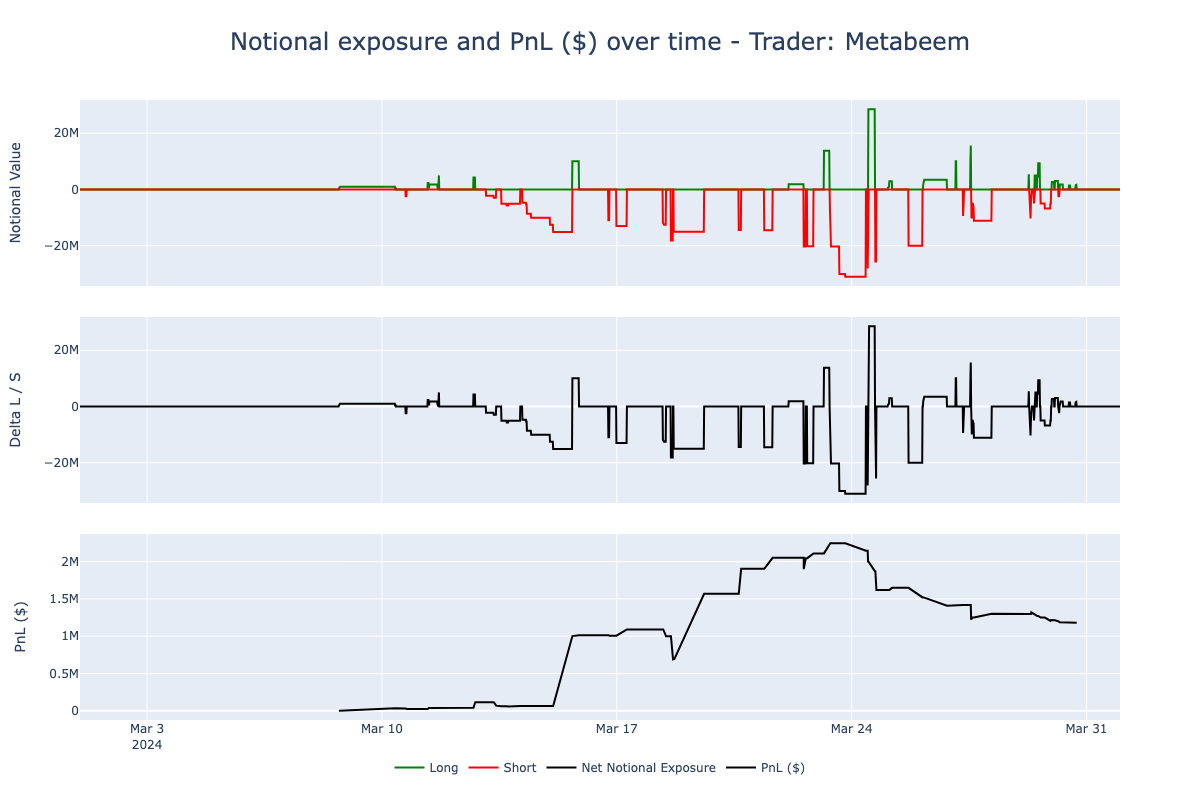
3.1. Notional exposure and PnL ($)#
Throughout March, Metabeem predominantly maintained a net short positioning in terms of notional market exposure.
Out of the 60 positions he closed, 56.7% were shorts, but more significantly, in terms of dollar value, his average net notional exposure was around a -$20 mln. This positioning proved especially advantageous between the 14th and 20th of March, a period during which BTC experienced a nearly 16% decline.
However, the market's reversal towards the end of the month saw Metabeem losing about half of his profits.
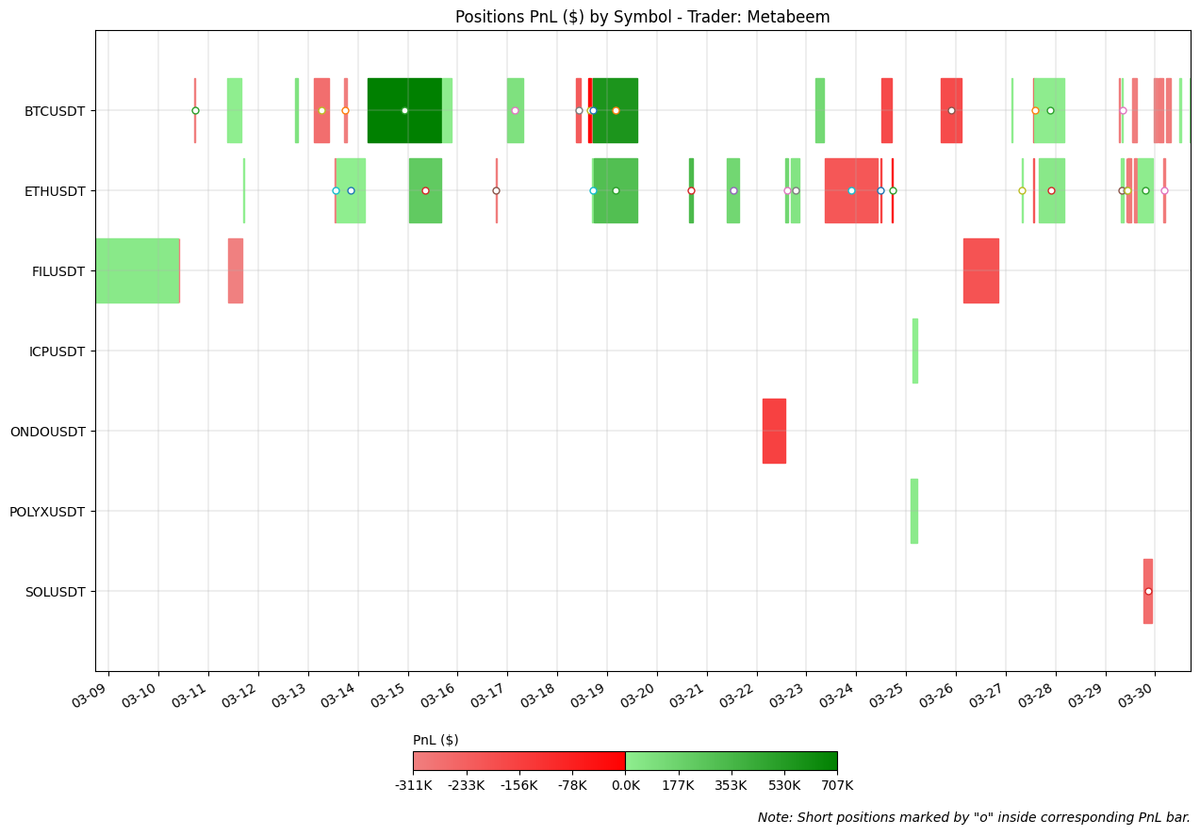
The figure below displays, for each closed position, the PnL ($) by symbol traded and their holding period.
The figure below displays the TotalPnL ($) by symbol traded.
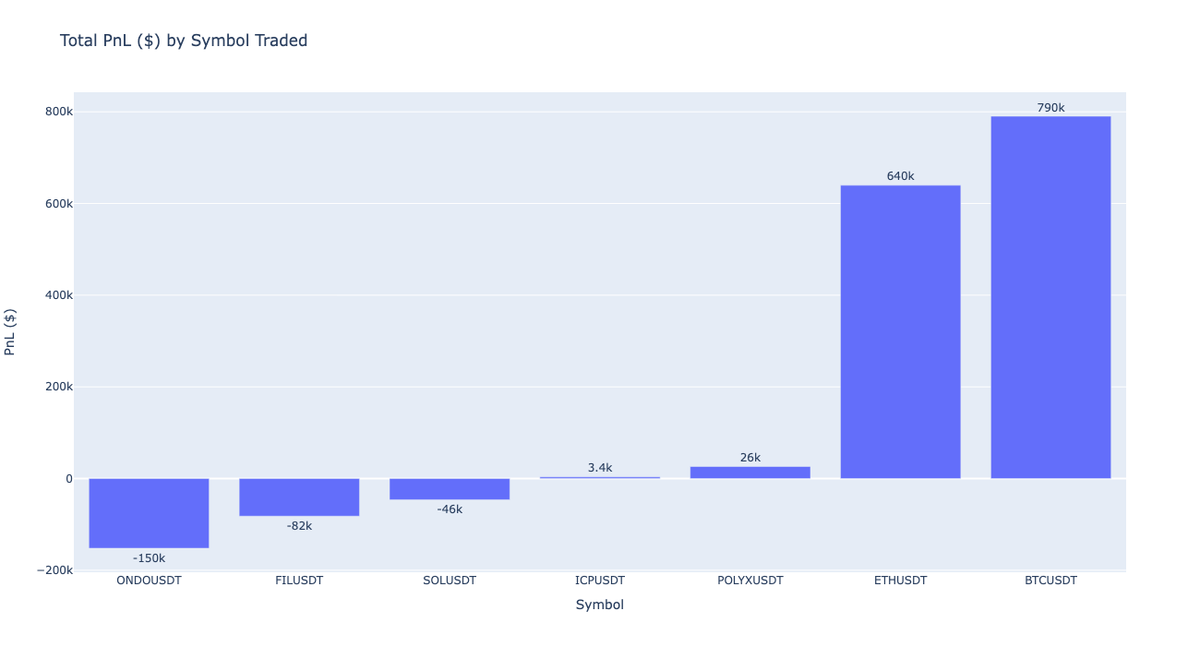
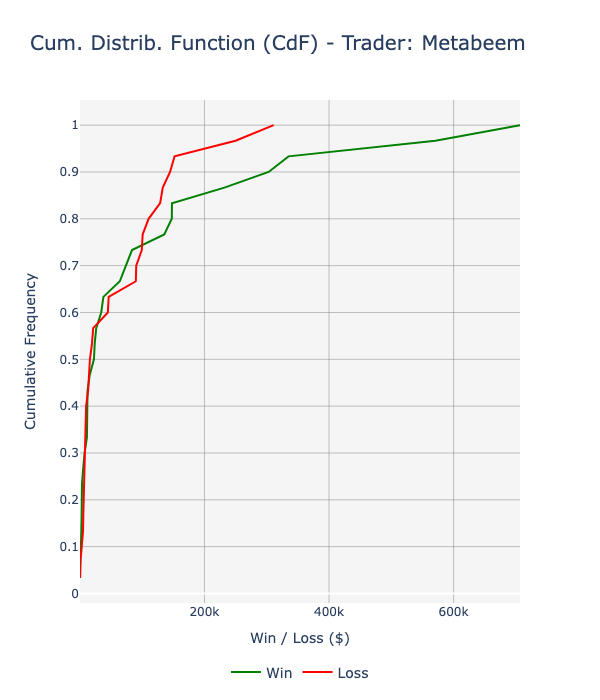
The cumulative distribution function (CdF) of his PnL is positively skewed (skewness: 2.16), with a positive edge since 75th percentile:
- 25th percentile: W/L ratio of 0.79 ($5.9k vs $-7.5k)
- 75th percentile: W/L ratio of 1.22 ($122.5k vs $-100.4k)
3.2. Position Case Studies#
BTCUSDT - Capitalizing on Declining Markets#
During the period between March 14th and March 19th, BTC went down almost 15%, and Metabeem capitalized from it.
We delve into three short trades executed on BTCUSD, yielding two wins and one loss. These three trades contributed to a combined profit of $967k (~82% of March total profit).
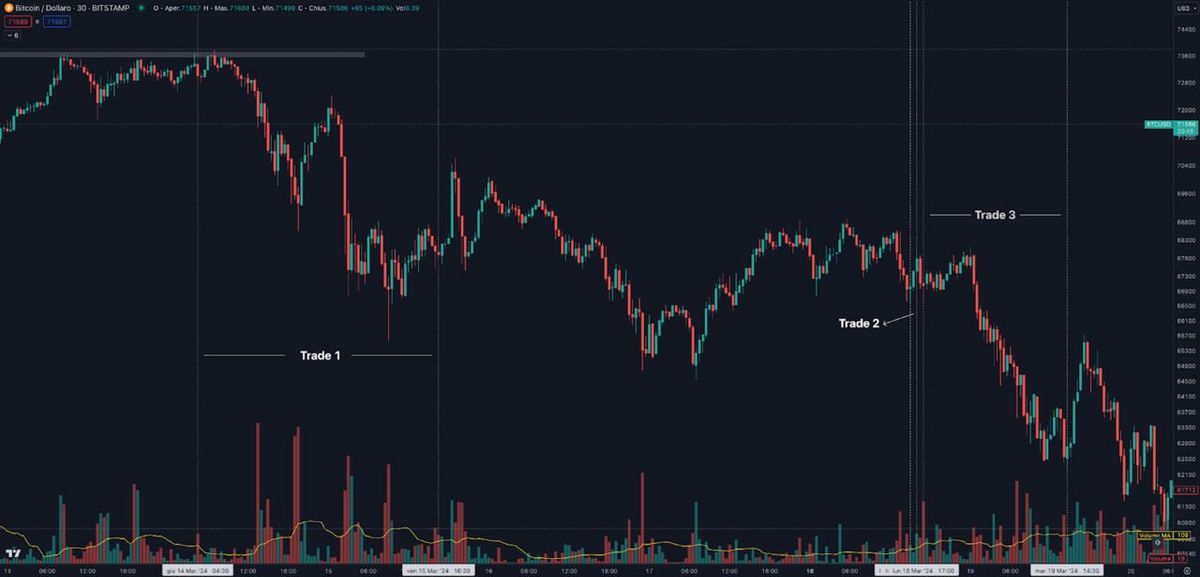
Below the details and position management of the trades executed:
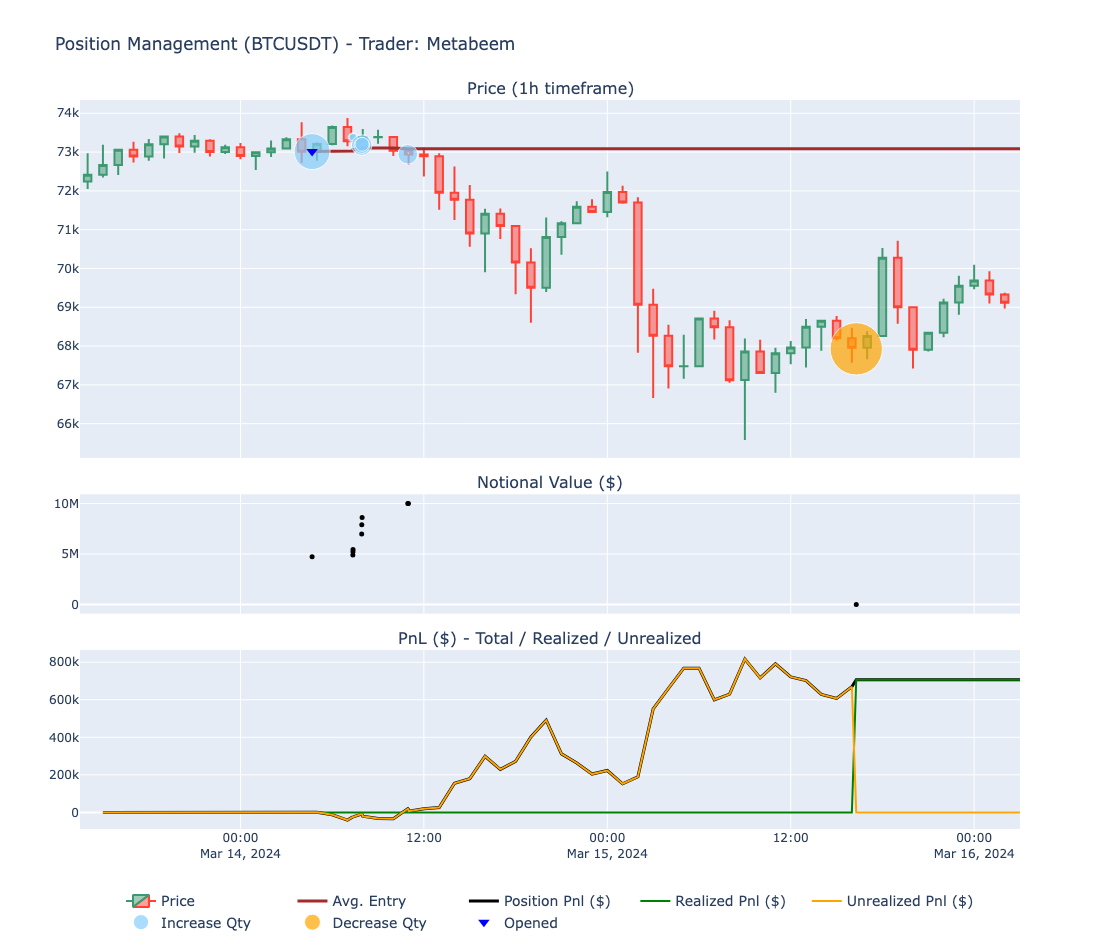
BTCUSDT (Trade 1) - Opened Mar 14th at 04:40 | Closed Mar 15th at 16:17:
- Side: Short
- Trades executed: 10
- Max DD ($): -$41k
- Final Pnl ($): $707k
- ROI (%): 7.0%
- Holding Period: ~1.5 days
In this particular trade, Metabeem demonstrated exceptional timing and precision, perfectly identifying the peak for BTC.
He initiated the position with $5 mln, increasing it to $10 mln at an average price of $73k. By closing the entire position around $68k, he secured a profit of $707k.
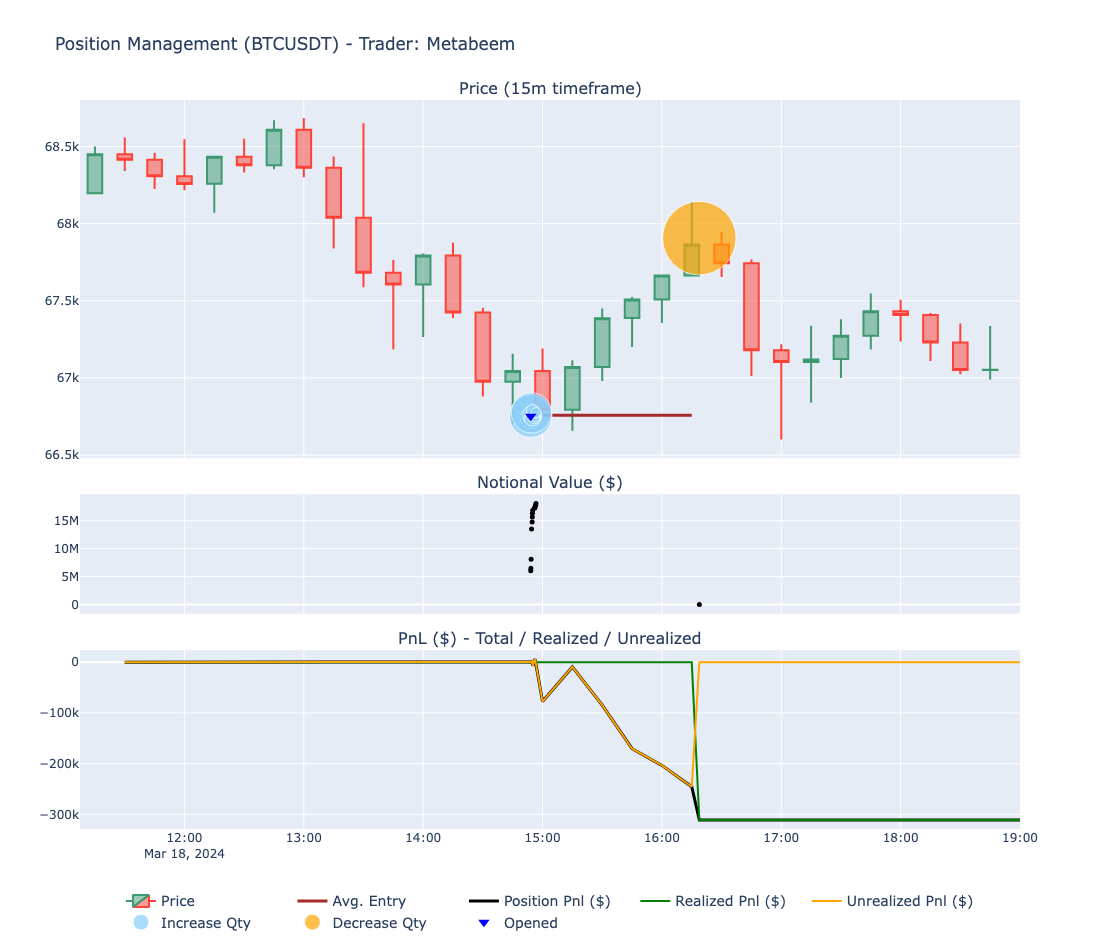
BTCUSDT (Trade 2) - Opened Mar 18th at 14:54 | Closed Mar 18th at 16:18:
- Side: Short
- Trades executed: 14
- Max DD ($): -$311k
- Final Pnl ($): -$311k
- ROI (%): 6.4%
- Holding Period: ~1.4 hours
In the second trade, Metabeem increased his stake, entering a position with a notional size of $18 mln, nearly double that of his first trade.
However, the market dynamics did not favor his strategy this time, as the price moved against him soon after the position was opened, resulting in a loss of $311k.
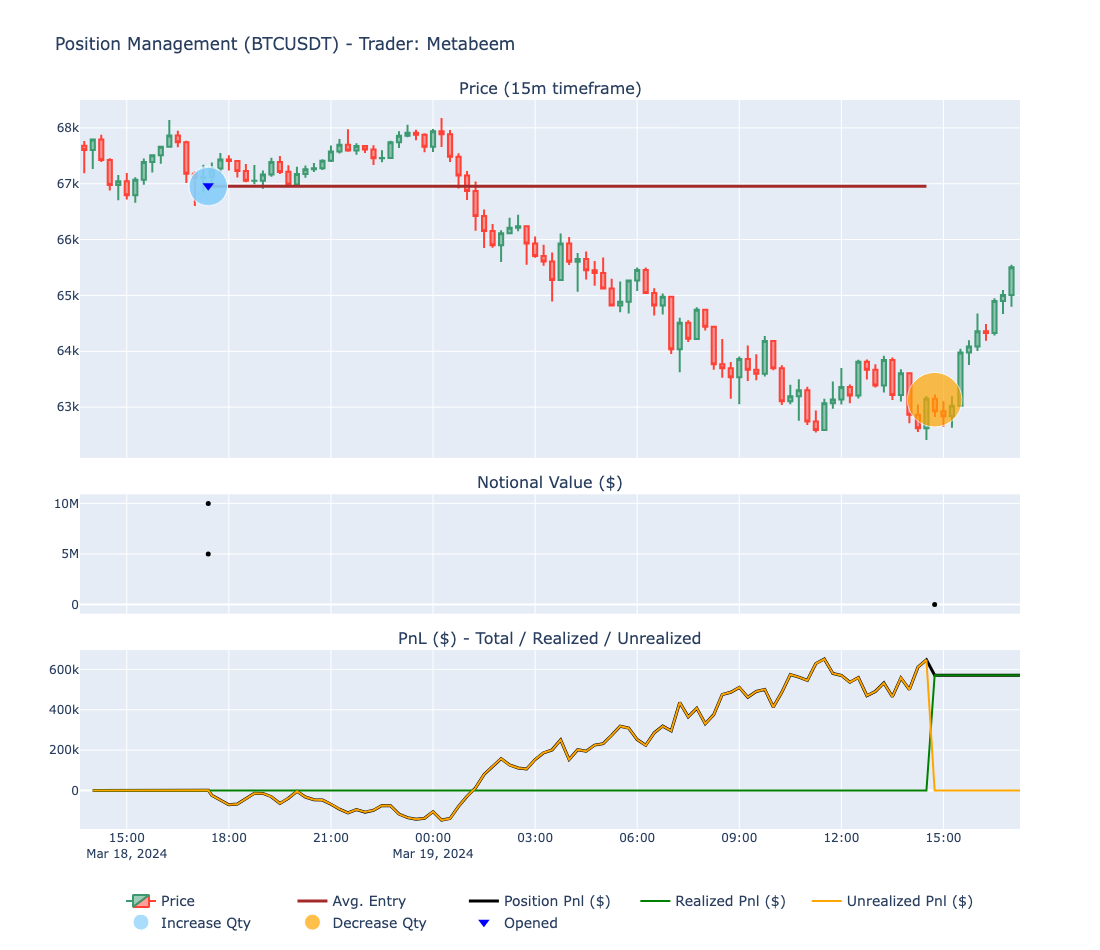
BTCUSDT (Trade 3) - Opened Mar 18th at 17:23 | Closed Mar 19th at 14:44:
- Side: Short
- Trades executed: 3
- Max DD ($): -$147k
- Final Pnl ($): +$571k
- ROI (%): 5.7%
- Holding Period: ~1 day
Just after 1 hour since his previous losing trade (ref. Trade 2), Metabeem displayed resilience by re-entering the market with a renewed short position, this time sizing it at $10 million, akin to his first successful trade.
Despite initially facing a downturn, with the position going underwater by $147k, the market eventually shifted in his favor, allowing him to exit the position around $63k, culminating in a profit of $571k.
4️⃣ Trader Spotlight: boink_boink#
4.1. Notional exposure and PnL ($)#
In contrast to Metabeem, boink_boink maintained a net long notional exposure throughout March.
His trading strategy showcased adaptability, marked by five significant turning points in his market exposure:
- March 1st to March 14th (BTC up ~20%): during this initial surge in Bitcoin's value, boink_boink adopted an aggressive stance with a net long exposure typically ranging between $1 mln and $2 mln, interspersed with brief spikes up to $4 million and $3 million. PnL during this period: +$630k.
- March 14th to March 19th (BTC down ~16%): as Bitcoin's value dipped, he significantly lowered his exposure to below $1 mln. This strategic reduction allowed him to preserve his profits and minimize losses, with a relatively modest drawdown. PnL during this period: -$60k.
- March 20th to March 22nd (BTC bounced almost 10% from the lows): capitalizing on the market rebound, boink_boink swiftly increased his long exposure to around $2 mln. PnL during this period: +$170k.
- March 23rd to March 26th (BTC up ~10%): initially, he moved his exposure to $0, however, as confidence grew with the market's strength, he gradually increased his long exposure again. PnL during this period: +$47k.
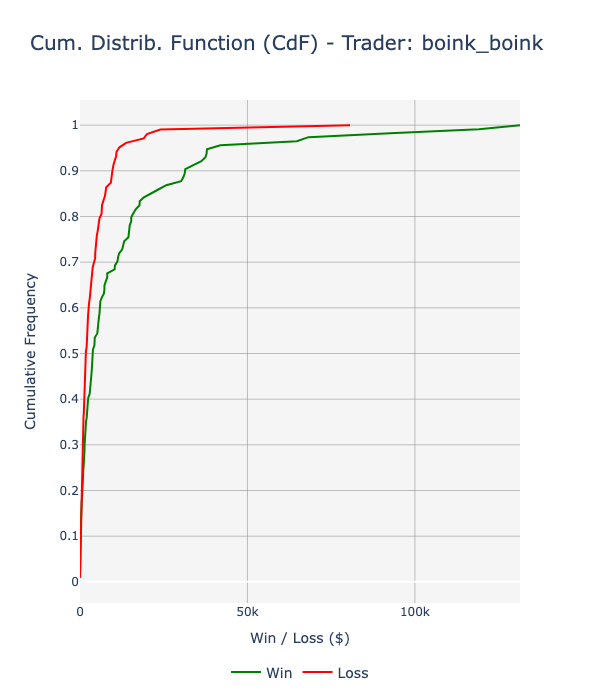
- March 27th to March 31st (BTC up 2%): he significantly increased his exposure to over $4 mln, probably anticipating a breakout after a few days of consolidation. However, as soon as the breakout was invalidated, he promptly scaled back to around $1 mln and eventually nearly $0. PnL during this period: +$130k. The figure below displays, for each closed position in March ‘24, the PnL ($) by symbol traded and their holding period. Worth noticing that during this period boink_boink traded 90 symbols. The figure below displays the TotalPnL ($) by symbol traded. The cumulative distribution function (CdF) of his PnL is positively skewed (skewness: 3.21), with a strong positive edge since lower percentiles
- 25th percentile: W/L ratio of 1.57 ($1.1k vs $-0.7k)
- 50th percentile: W/L ratio of 2.17 ($3.9k vs $-1.8k)
- 75th percentile: W/L ratio of 2.88 ($14.1k vs $-4.9k
4.2. Position Case Studies#
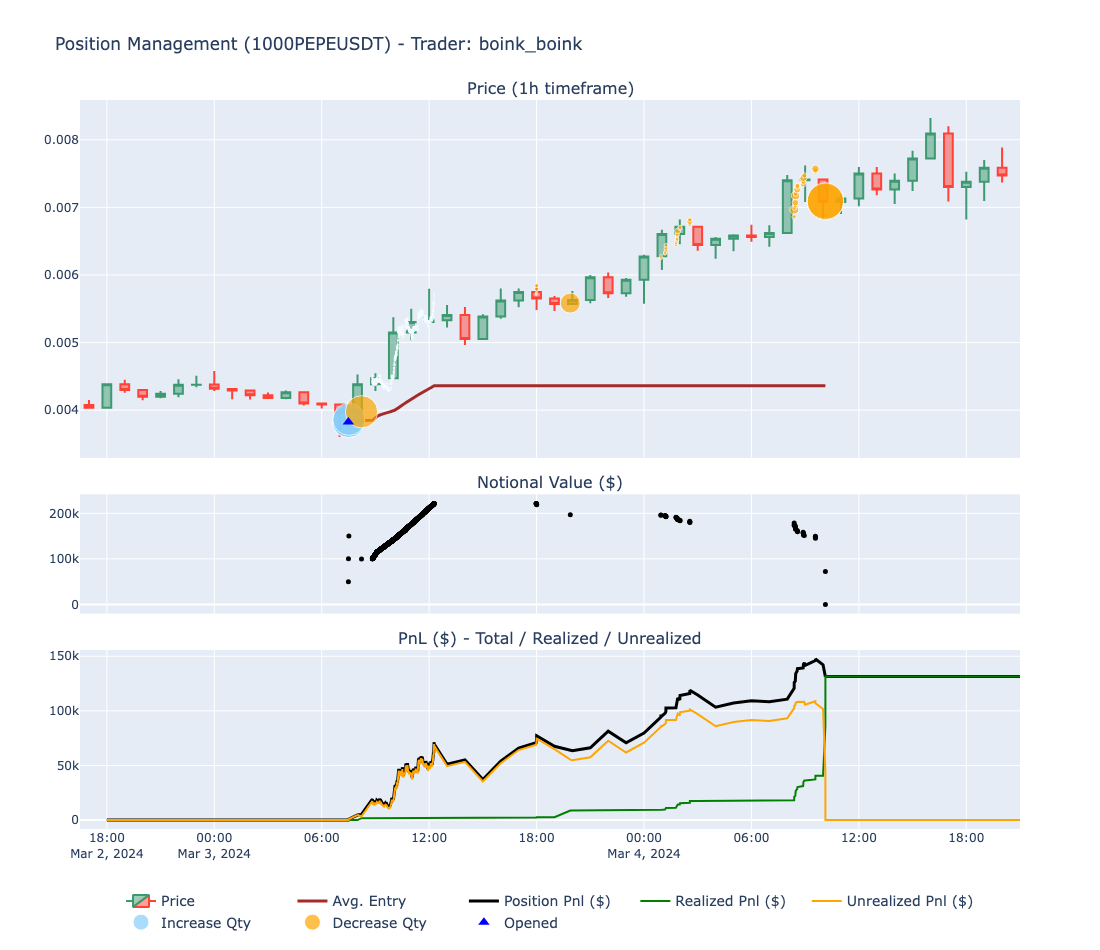
PEPEUSDT - Scaling Up a Winning Position#
Opened Mar 3rd ‘24 | Closed Mar 04th ‘24:
- Side: Long
- Trades executed: 1777
- Max DD ($): $0k
- Final Pnl ($): $131k
- ROI (%): 59.2%
- Holding Period: ~1.1 days
In March, boink_boink's most profitable trade resulted in a gain of $131k, accounting for 7.3% of his total PnL for the month.
The coin in question, PEPE, had been on an upward trajectory since the end of February. At the beginning of March, as its price began consolidating and briefly swept the lows of the support area around $0.0039, boink_boink initiated to scale into a long position.
This trade is particularly noteworthy due to boink_boink's approach. Starting with a position worth $100k, he clearly executed a TWAP strategy over nearly 3 hours, enlarging his position to $220k.
This strategy adjusted his average entry point from $0.0038 to $0.0043. As the price ascended, he slowly secured profits, ultimately closing the entire position after an 84% move from PEPE.
5️⃣ Trader Spotlight: CnTraderT#
5.1. Notional exposure and PnL ($)#
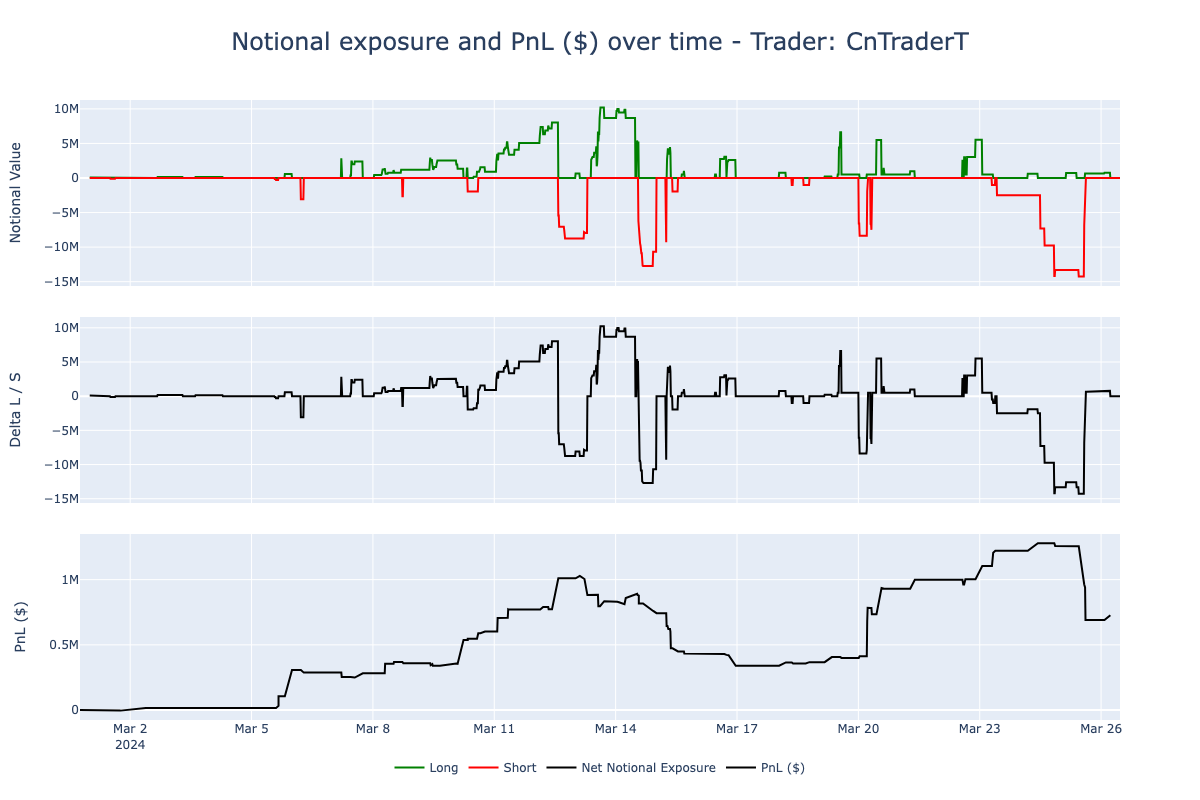
CnTraderT exhibited a dynamic trading approach throughout March, frequently alternating between net long and net short notional exposures, with sizes fluctuating from +$10 mln to -$15 mln.
This strategy is reflected in his PnL curve, which distinctly showcases the impact of his market positioning on his profits.
In the early part of the month, up until around March 12th, CnTraderT's strategy to maintain a long position yielded significant returns, contributing to a major profit of over $1 million. However, the period between March 12th and March 20th saw him changing his market stance multiple times. This indecision and rapid shifting between long and short positions led to a substantial loss of about $660k.
Despite the mid-month setbacks, CnTraderT managed to recalibrate his strategy in the latter part of the month. By adapting to market movements, he successfully recuperated some of his losses, ultimately closing the month with a great profit of $727k.
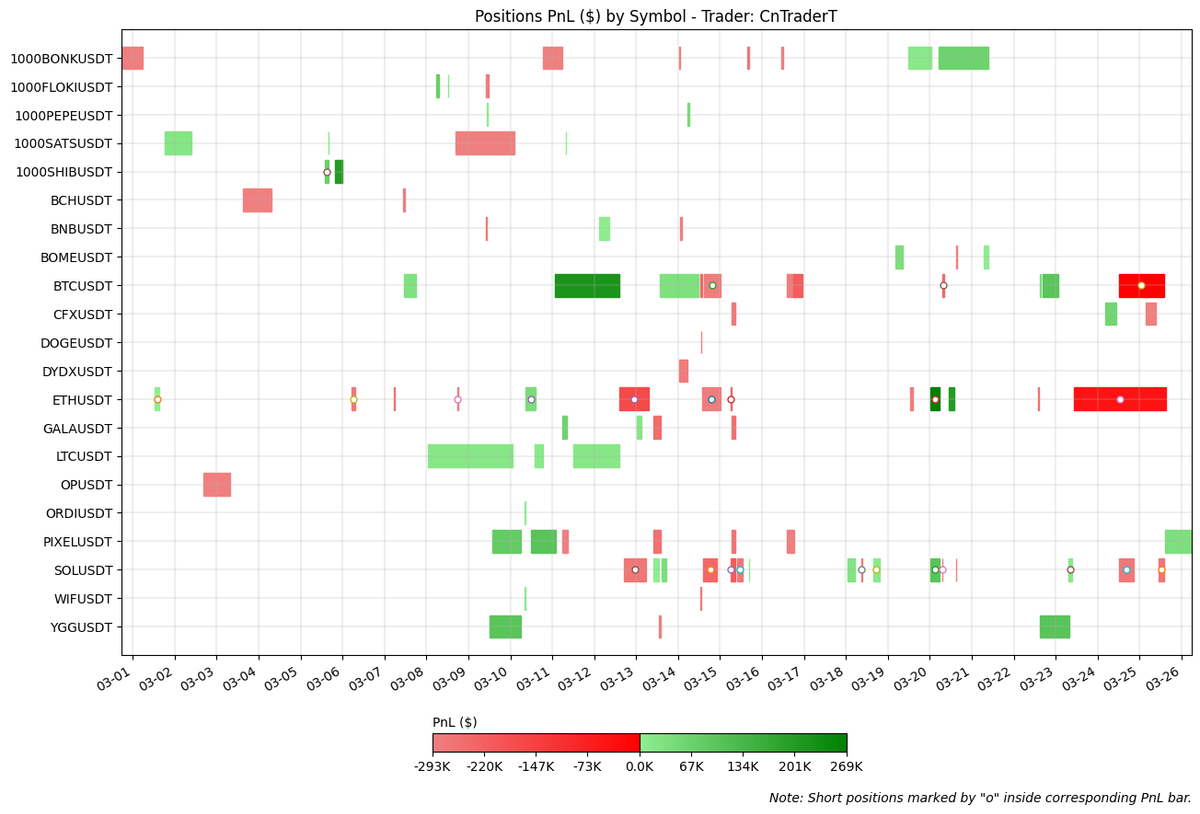
The figure below displays, for each closed position in March ‘24, the PnL ($) by symbol traded and their holding period.
The figure below displays the TotalPnL ($) by symbol traded.
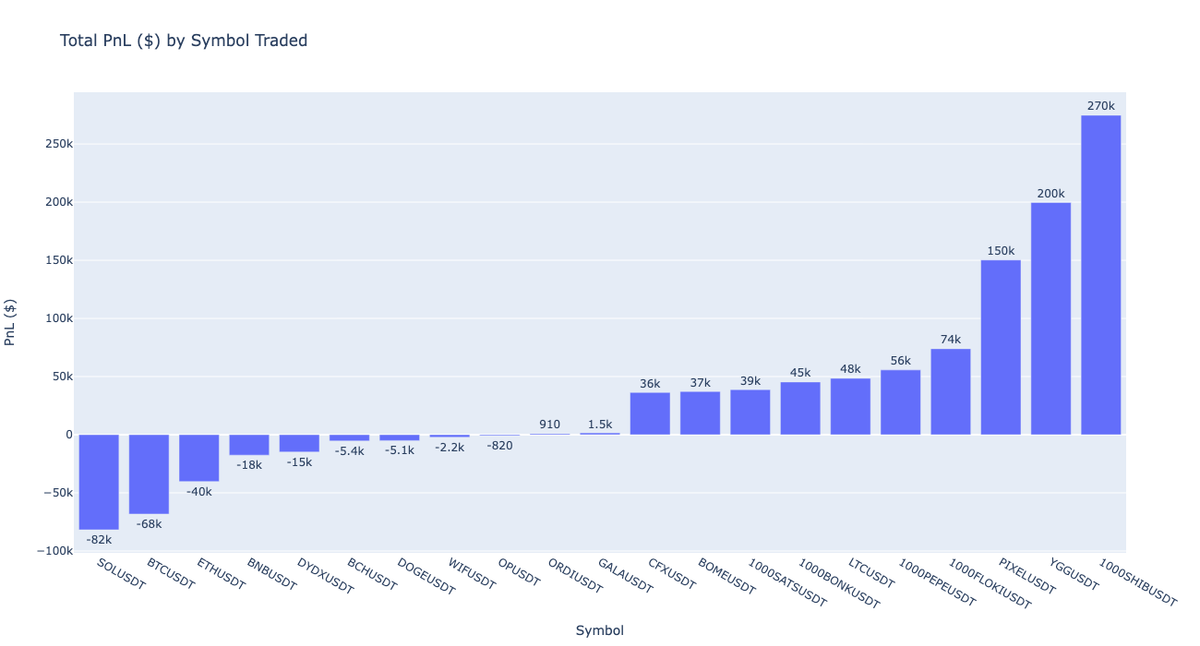
The cumulative distribution function (CdF) of his PnL is negatively skewed (skewness: -0.07), with a positive but decreasing edge since lower percentiles:
- 25th percentile: W/L ratio of 2.96 ($13.6k vs $-4.6k)
- 25th percentile: W/L ratio of 2.39 ($32.7k vs $-13.7k)
- 75th percentile: W/L ratio of 2.11 ($73.3k vs $-34.7k) 5.2. Position Case StudiesBTCUSDT - Trying to Pyramid on the Way Up Opened Mar 11th ‘24 | Closed Mar 12th ‘24: CnTraderT initiated a long position just above Bitcoin's previous ATH from 2021, seizing an opportunity as the price stabilized above the $67k mark. After a brief sell-off, which was promptly followed by strong buying momentum, he entered a $4 million long position. As the price ascended from $68k to the $72k zone, CnTraderT aimed to capitalize further by pyramiding his position at the newly established support area. This strategy increased his notional investment to $6 million, adjusting his average entry price from $68k to $69.7k. The decision to increase his stake at this spot was a comfy one, anticipating a continued upward trajectory. However, upon facing a strong rejection at the $73k resistance level, he quickly closed the entire position, securing a profit of $220k (5.6% contribution to his total PnL). 6️⃣ Conclusion Stay connected for more insights in the upcoming month's edition.
- Side: Long
- Trades executed: 8
- Max DD ($): -$3.2k
- Final Pnl ($): +$220k
- ROI (%): +3.5%
- Holding Period: ~1.5 days
- Metabeem stood out for maintaining a net short position throughout March, capitalizing significantly until the 20th of March. However, as the markets shifted favorably towards the end of the month, he gave back nearly half of his profits.
- boink_boink exhibited the most impressive performance metrics among the trio, as evidenced by his PnL curve, which showed minimal drawdowns. Consistently net long throughout March, boink_boink managed to secure a total profit comparable to that of Metabeem and CnTraderT but with considerably lower average exposure. His success underscores an exceptional ability to synchronize his position sizing with the market's overall direction, demonstrating precision in timing and risk management.
- CnTraderT was the most versatile, frequently altering his market exposure from net long to short and vice versa. This flexibility probably contributed to his volatile PnL curve, marked by pronounced peaks and troughs. The fluctuations in his performance likely stemmed from the challenges of adapting to rapidly changing market conditions.
- Follow our highlight traders on Twitter: Metabeem: please if you know, let us know his twitter handle boink_boink: https://twitter.com/boink__boink CnTraderT: please if you know, let us know his twitter handle
- Data analysis provided by@0xfab_eth. Drop him a follow!
- BETA ACCESS:https://portal.mirrorly.xyz/beta-application?referralCode=0xfab Subscribe to our Notifications so you don't miss next month's report!