
Top Traders Report - May '26#
Introduction#
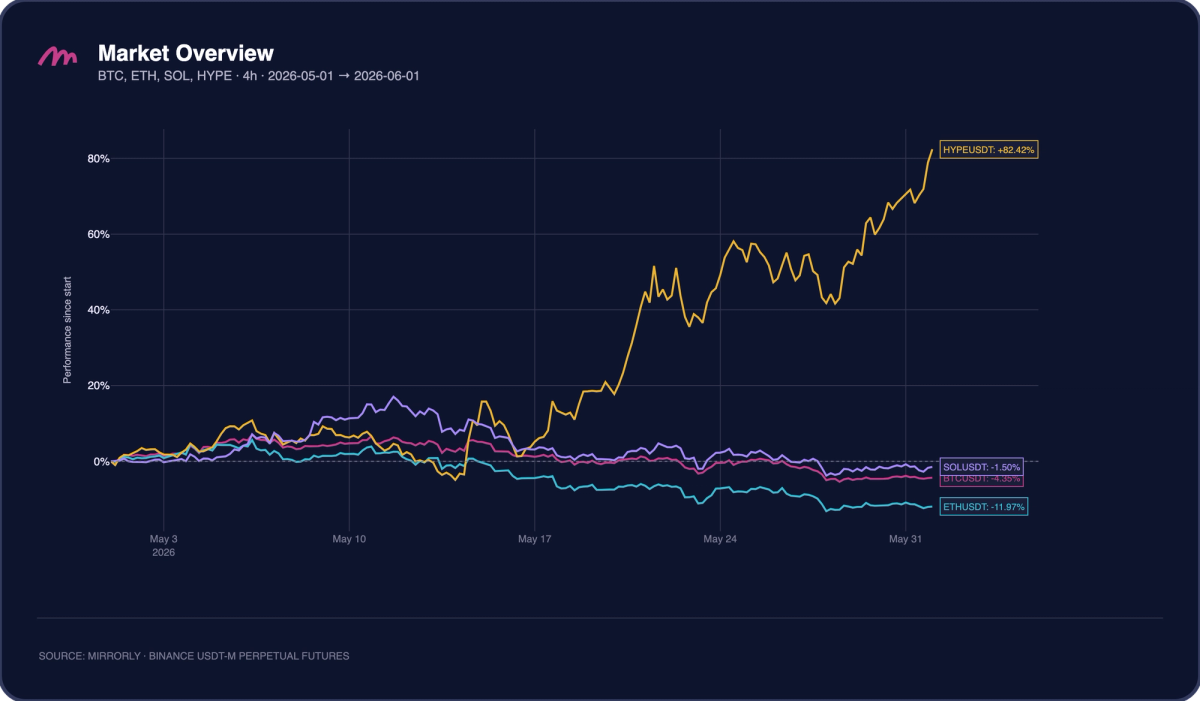
May was a highly selective month across the major crypto perps shown in this report. $HYPE was the clear relative strength outlier, finishing the period up roughly +82.4% after accelerating through the second half of the month. By contrast, the rest of the group ended negative: $SOL finished around -1.5%, $BTC around -4.4%, and $ETH around -12.0%.
This month Mirrorly’s top 3 traders are:
🏆 Shadow Wallaby (Hyperliquid): +$2.99M
🥈 Crystal Tasmanian (Hyperliquid): +$2.59M
🥉 Venom Gibbon (Hyperliquid): +$2.25M
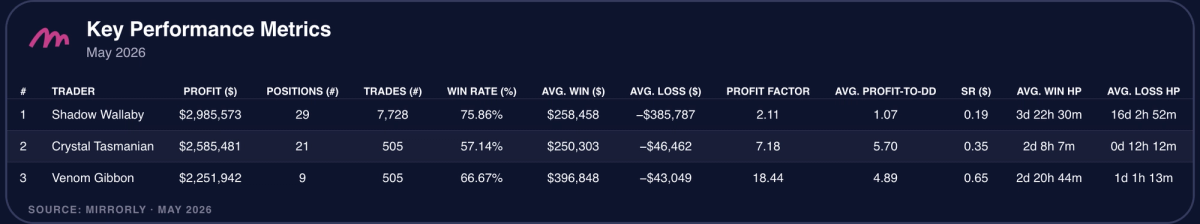
Shadow Wallaby led May with $2.99M in profit across 29 closed positions, while executing 7,728 trades inside those positions. His win rate was strong at 75.86%, but the payoff profile was not one sided: the average loss was about $385.8K, larger than the average win of $258.5K. The month still produced a profit factor of 2.11 because winning positions were much more frequent. His holding periods also show a clear contrast, with winners held for about 3 days and 22 hours on average, while losing positions were held for more than 16 days.
Crystal Tasmanian finished second with $2.59M in profit across 21 closed positions and 505 trades. His win rate was lower than Shadow Wallaby’s at 57.14%, but the average win of $250.3K was more than five times the average loss of $46.5K. That asymmetry explains the much higher profit factor of 7.18 and the strongest average profit-to-drawdown ratio among the top two traders at 5.70. He also cut losing positions quickly, holding them for only about 12 hours on average versus more than 2 days for winners.
Venom Gibbon generated $2.25M across only 9 closed positions, also with 505 trades. His win rate was 66.67%, but the key feature was payoff quality: the average win was $396.8K versus an average loss of $43.0K, producing the highest profit factor of the group at 18.44. He also had the strongest Sharpe ratio in the table at 0.65, with winning positions held for nearly 3 days on average and losing positions held for just over 1 day.
Trader Spotlight: Shadow Wallaby#
Notional Exposure and PnL#
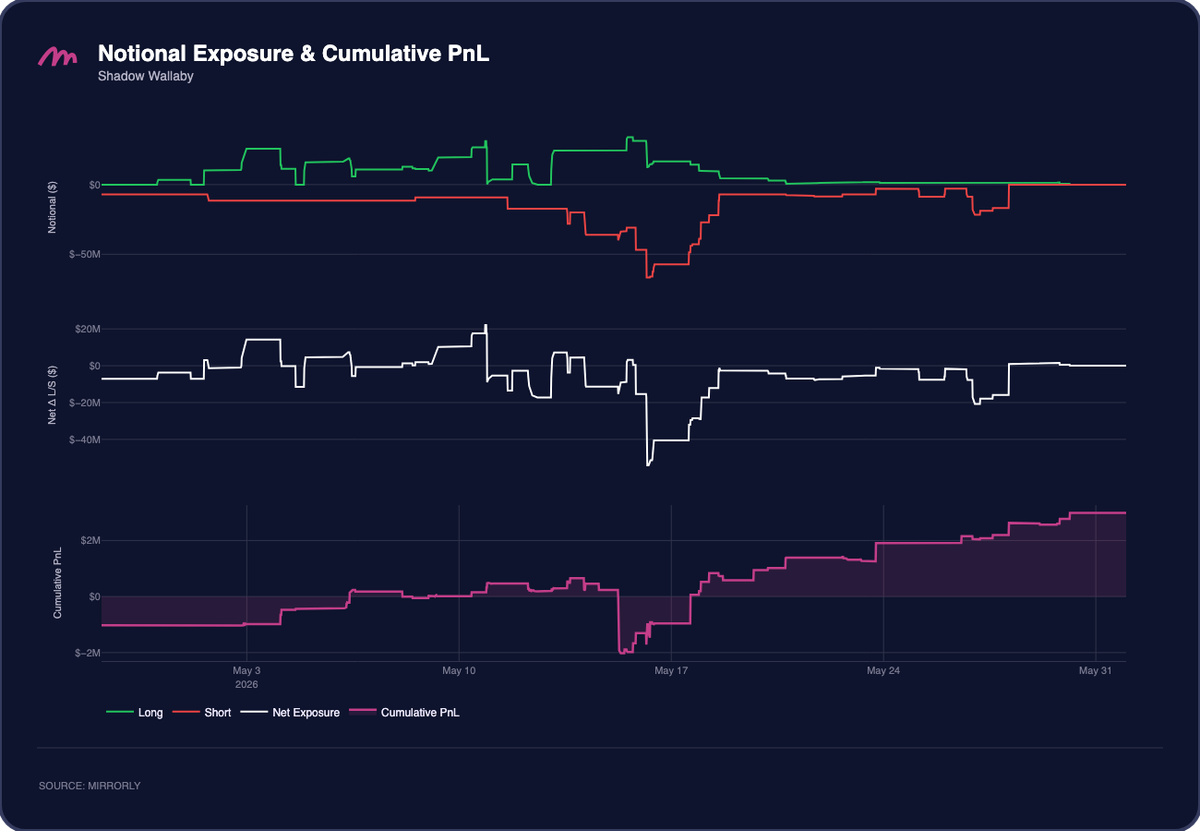
Shadow Wallaby ran the most complex book of the three. Early in the month, he carried long exposure that often ranged from roughly +$10M to +$25M, with net exposure briefly approaching +$20M around May 10. The middle of the month was the main stress point: short exposure expanded sharply around May 15 and May 16, reaching roughly -$65M, while net exposure fell toward -$55M. His cumulative PnL dropped to around -$2M during that period before recovering as the position set was unwound.
After May 17, the PnL curve quickly recovered and then moved higher into the final week. By late May, his exposure was much smaller and closer to neutral, while cumulative PnL continued to build toward the final +$2.99M result. The chart shows a month defined by one large mid-month drawdown and a strong recovery, rather than a smooth accumulation path.
Positions PnL by Symbol#
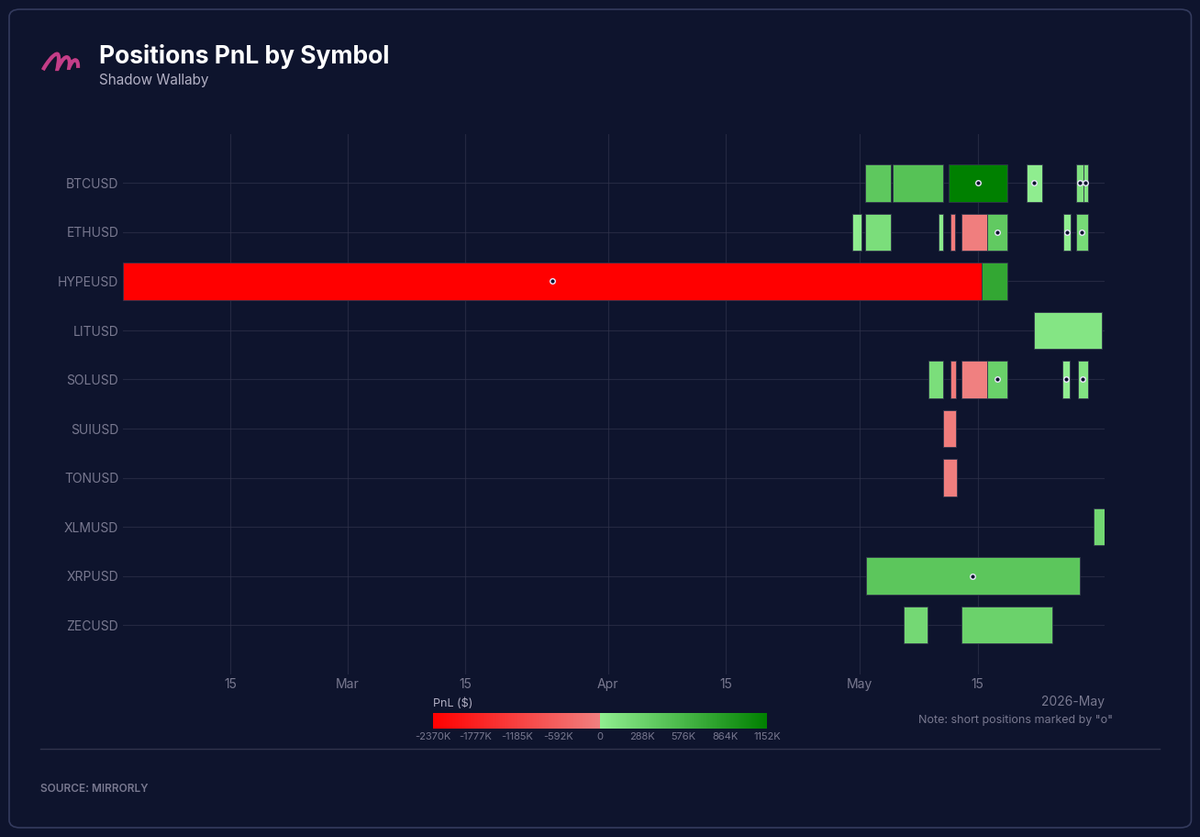
Shadow Wallaby traded the broadest set of the three, with activity across $BTC, $ETH, $HYPE, $LIT, $SOL, $SUI, $TON, $XLM, $XRP, and $ZEC. The chart shows that the largest negative position came from $HYPE, while many of the later profitable positions were concentrated in $BTC, $ETH, $SOL, $XRP, and $ZEC.
Total PnL by Symbol#
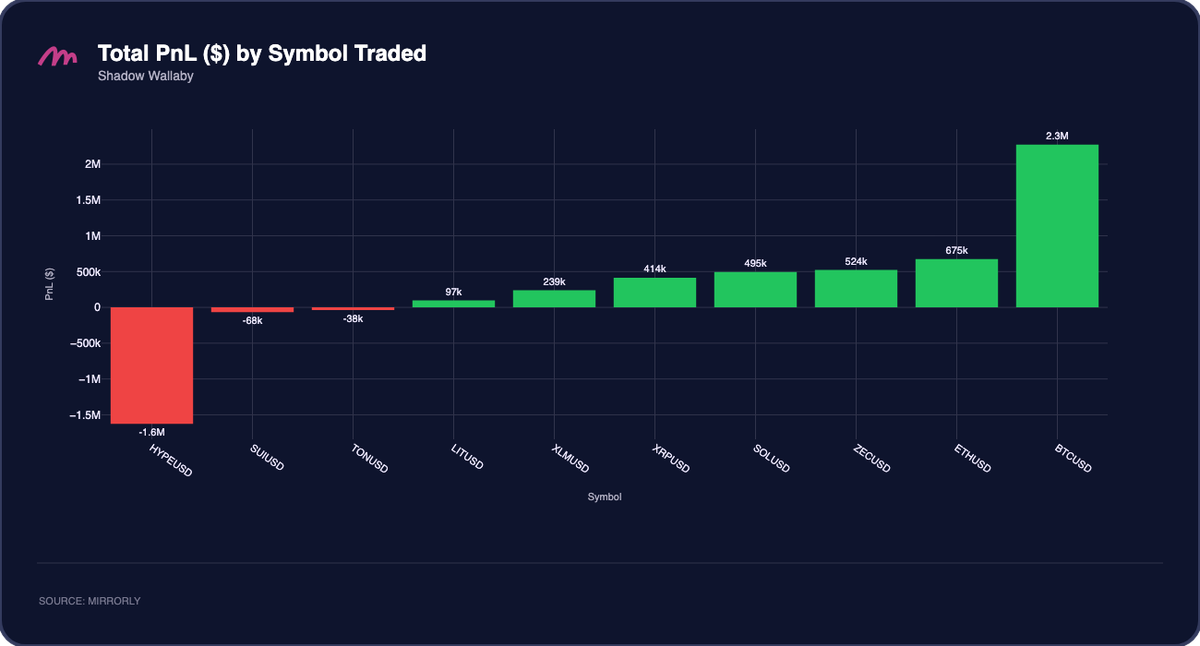
Shadow Wallaby’s total symbol-level results show how much the rest of the book had to offset the $HYPE loss. $BTC was the main contributor at roughly +$2.3M, followed by $ETH at about +$675K, $ZEC at +$524K, $SOL at +$495K, and $XRP at +$414K. These gains outweighed the largest losing symbol, $HYPE at approximately -$1.6M, plus smaller losses in $SUI and $TON.
PnL Distribution#
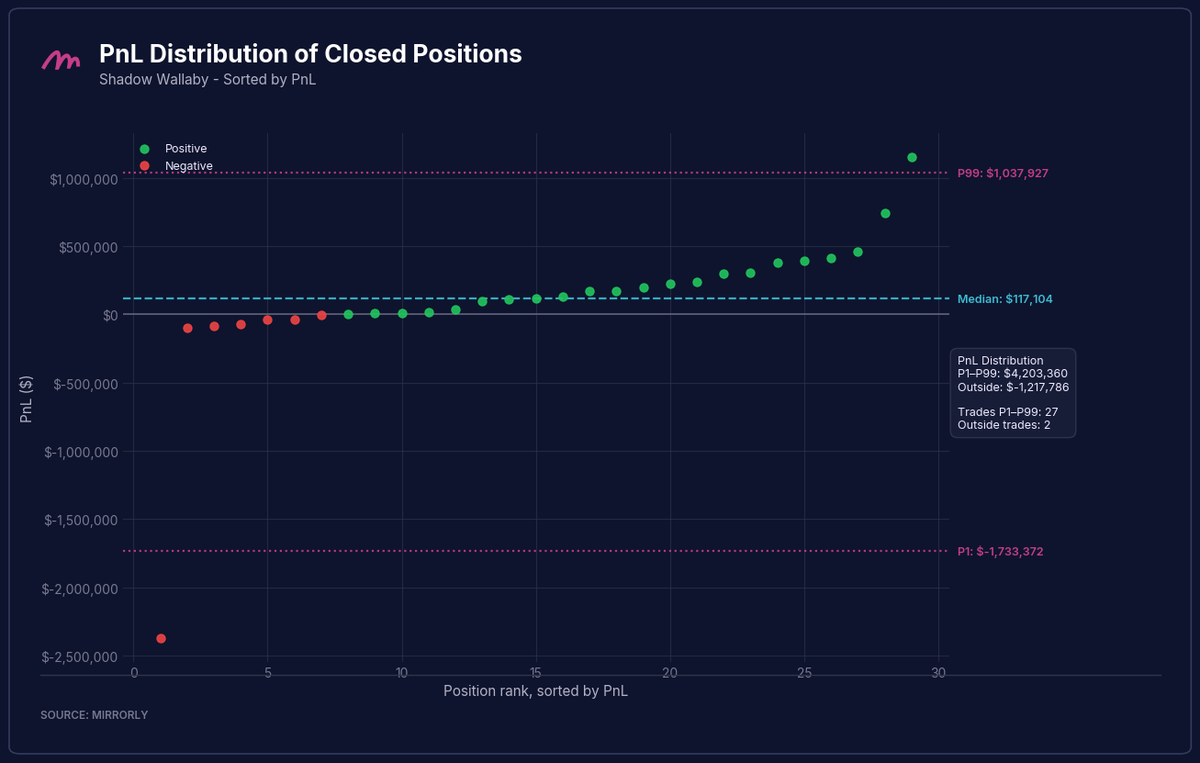
Shadow Wallaby’s distribution had a positive median but meaningful tail risk. The median closed position was +$117.1K, and the P99 level was about +$1.04M, while the P1 level was much lower at roughly -$1.73M. The 27 positions inside the P1 to P99 range produced +$4.20M, but the two outside positions were negative in aggregate at -$1.22M. This explains the final result: most trades were profitable enough to offset one very large losing tail.
Trader Spotlight: Crystal Tasmanian#
Notional Exposure and PnL#
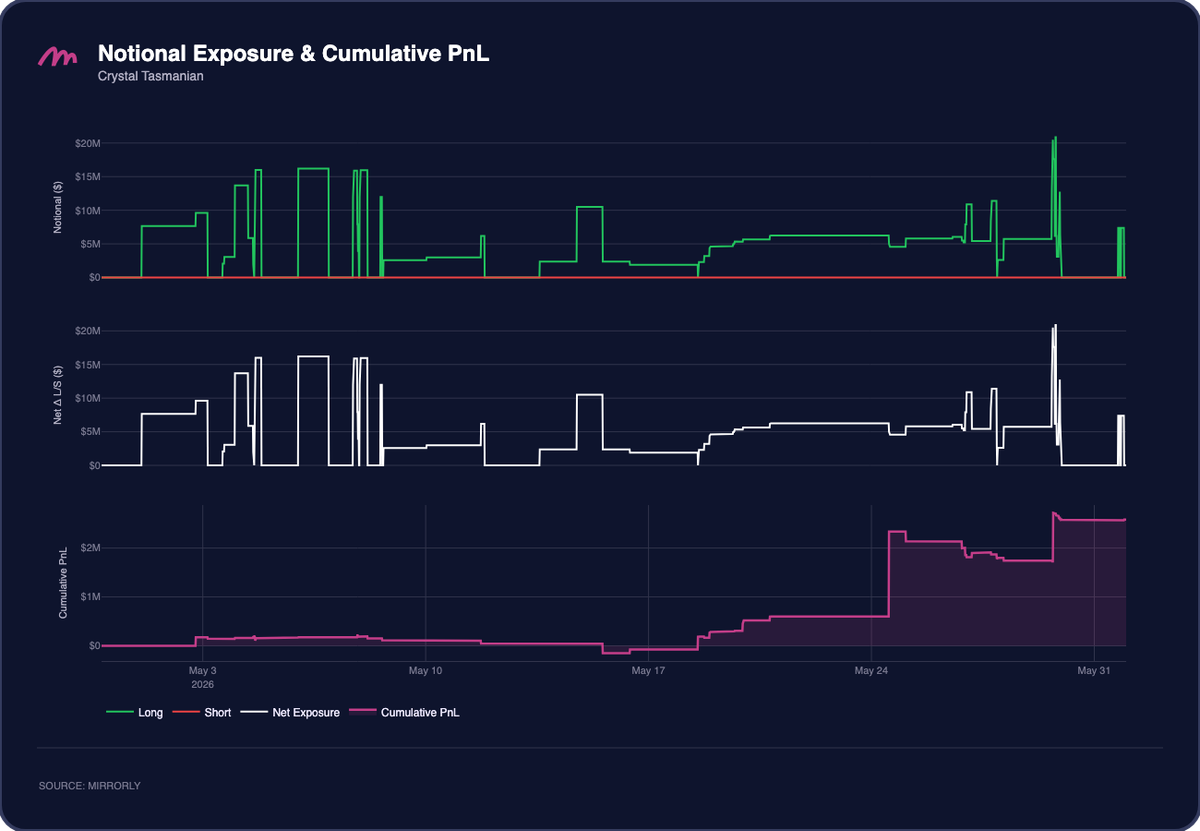
Crystal Tasmanian followed a clean long-only profile throughout May. Early exposure appeared in short bursts, often between roughly +$8M and +$16M, before the book became more measured through the middle of the month. From May 18 onward, he rebuilt long exposure and his PnL began to move higher, with the largest increase arriving around May 24.
The final week shows the highest notional event on the chart, briefly reaching above +$20M before exposure was reduced. Cumulative PnL moved from near breakeven in the first half of the month to more than +$2M after May 24, and finished close to the key stats result of +$2.59M. The profile is much cleaner than Shadow Wallaby’s: no short book, smaller drawdowns, and performance driven by long exposure in a strong relative-strength asset.
Positions PnL by Symbol#
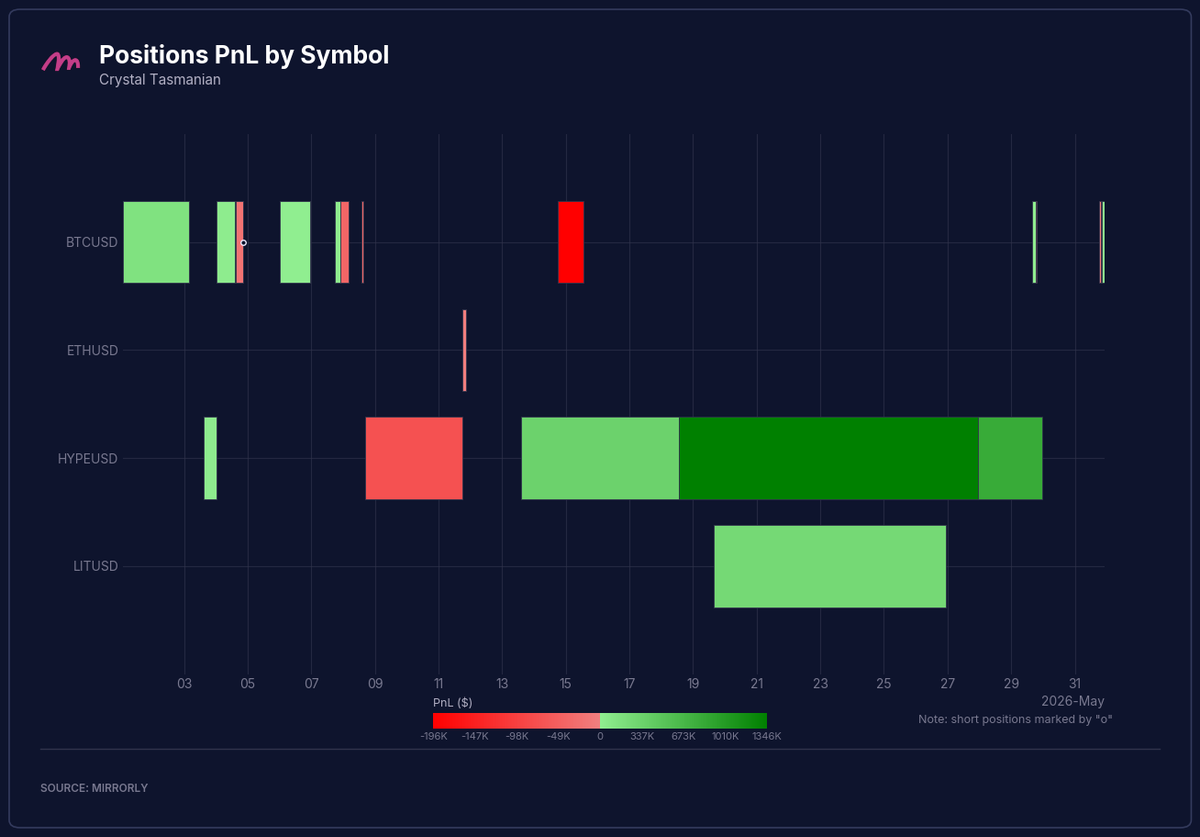
Crystal Tasmanian traded only four symbols: $BTC, $ETH, $HYPE, and $LIT. The position chart shows that the month was dominated by $HYPE activity, with one large profitable stretch through the second half of May and smaller losses earlier in the month.
Total PnL by Symbol#
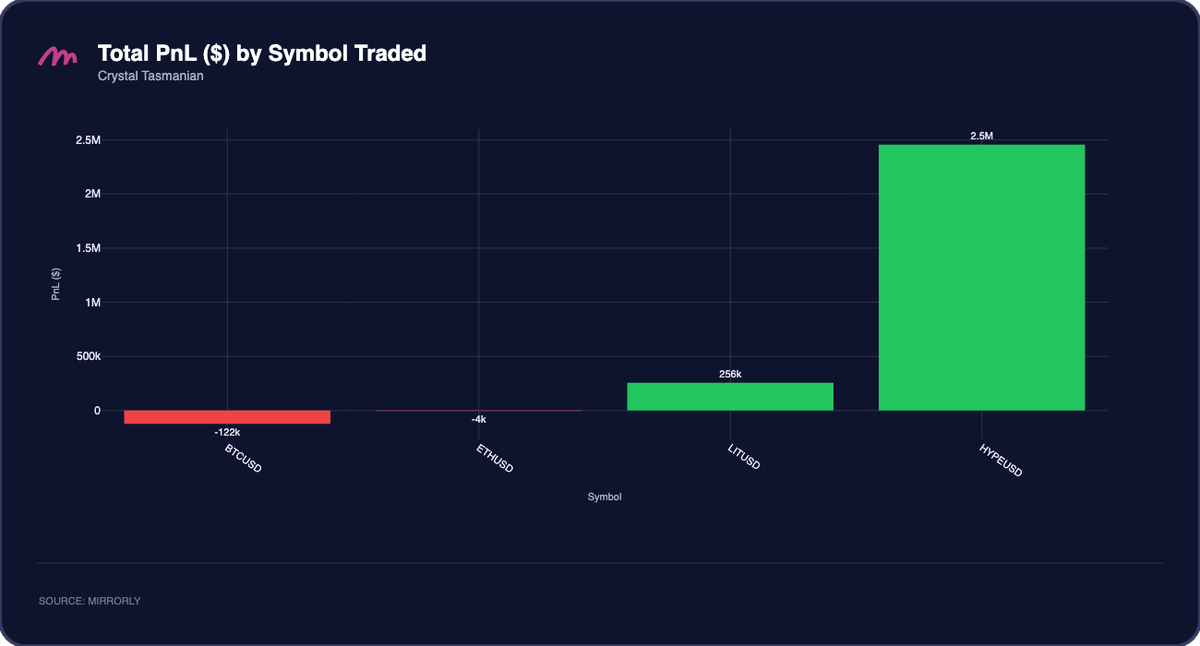
Crystal Tasmanian’s month was almost entirely driven by $HYPE, which contributed roughly +$2.5M. $LIT added another +$256K, while $BTC and $ETH were small offsets at about -$122K and -$4K respectively. This was a concentrated $HYPE-led month, with one major symbol explaining nearly all of the final PnL.
PnL Distribution#
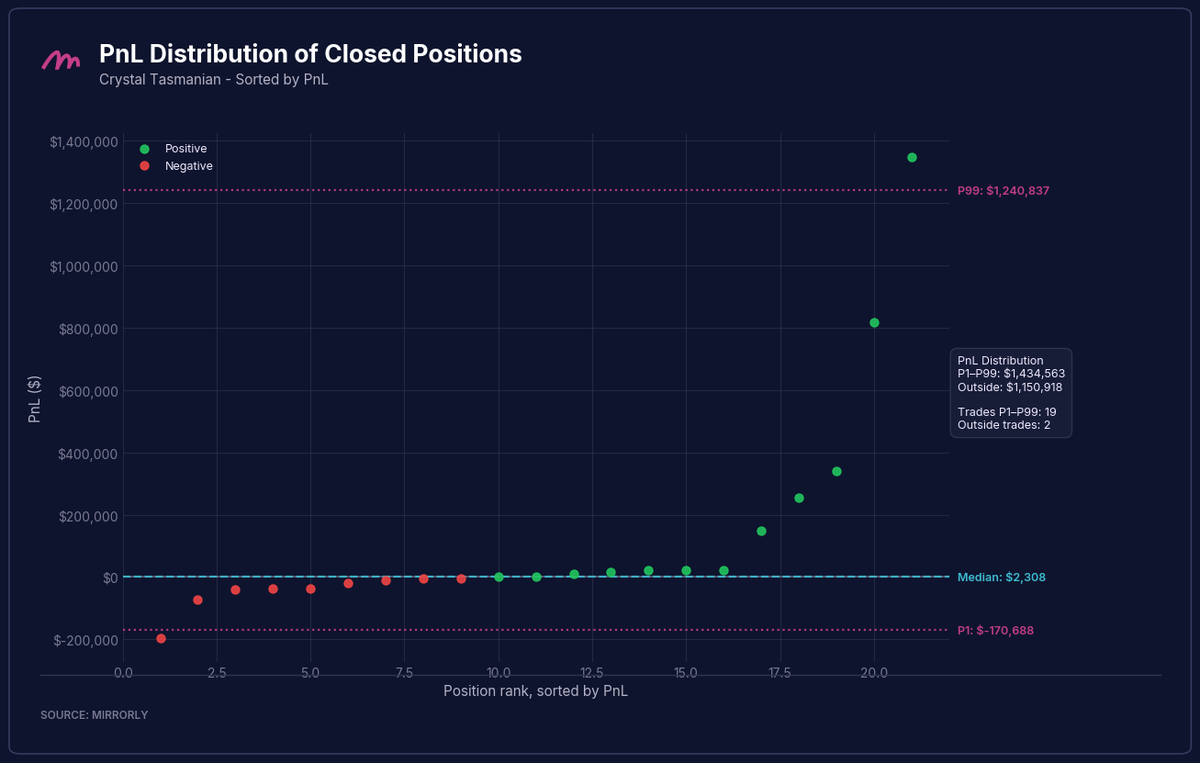
Crystal Tasmanian’s distribution shows a strong upper tail and limited downside. The median closed position was only +$2.3K, but the P99 level reached about +$1.24M, compared with a P1 level of roughly -$170.7K. The 19 positions inside the P1 to P99 range generated +$1.43M, while the two outside positions added another +$1.15M. This means the month was not only one trade, but the largest winners were still responsible for a large share of total profit.
Trader Spotlight: Venom Gibbon#
Notional Exposure and PnL#
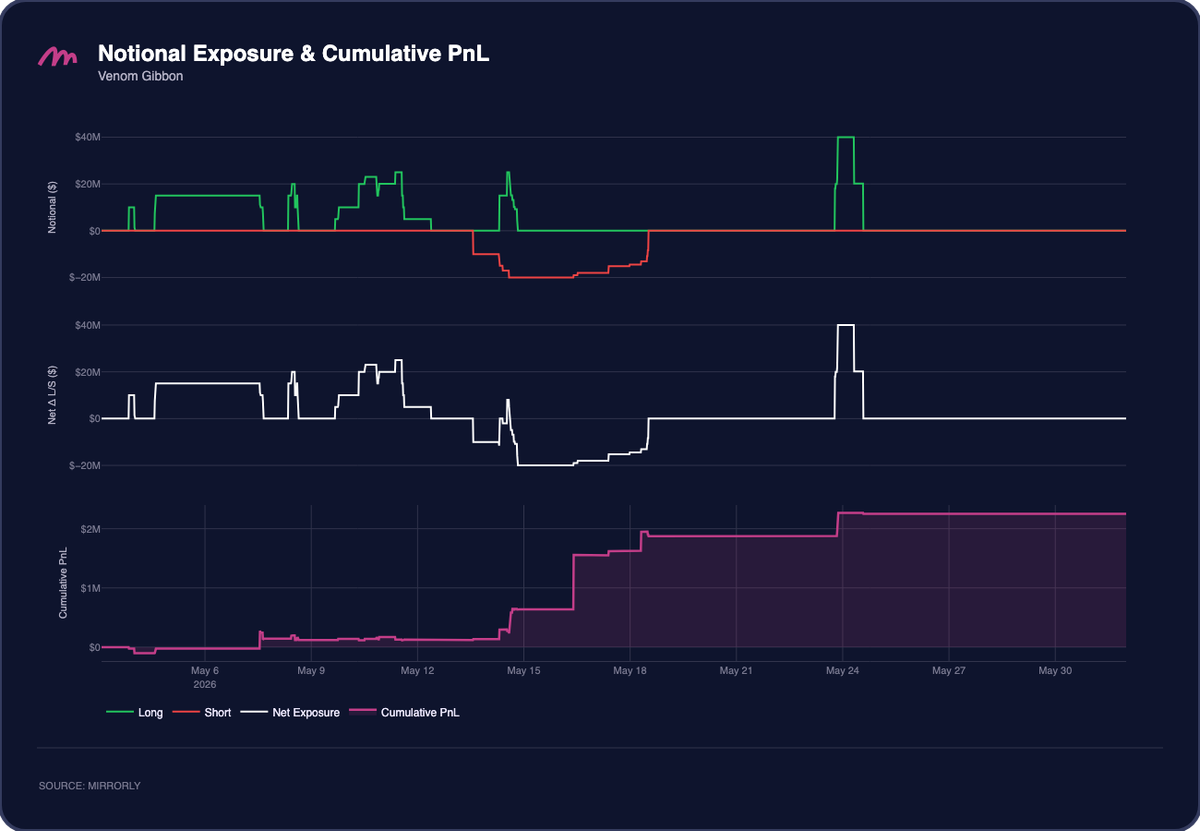
Venom Gibbon used fewer positions but deployed meaningful exposure at specific moments. In the first half of May, long notional often reached the +$15M to +$25M range, before the book flipped short around May 14 and May 15 with short exposure near -$20M. That mid-month repositioning coincided with a large move in cumulative PnL, which rose from near breakeven to more than +$1.5M.
After May 18, the book was mostly flat until a brief long exposure event around May 24, when net exposure reached close to +$40M. PnL increased again during that window and then stayed near +$2.25M through month end. Compared with the other two traders, Venom Gibbon’s chart is more stepwise: a small number of position windows created most of the monthly result.
Positions PnL by Symbol#
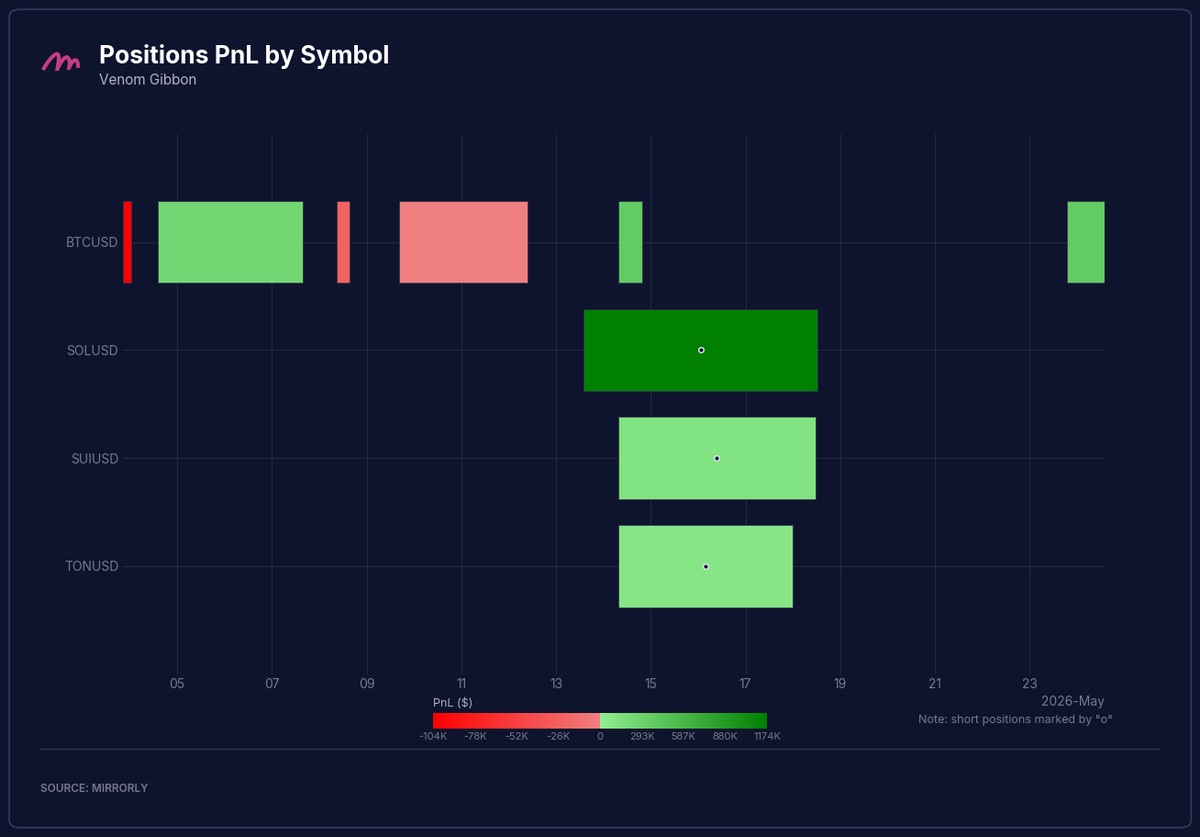
Venom Gibbon traded only four symbols: $BTC, $SOL, $SUI, and $TON. The strongest position activity was concentrated in $SOL and $BTC, while $SUI and $TON added smaller positive contributions.
Total PnL by Symbol#
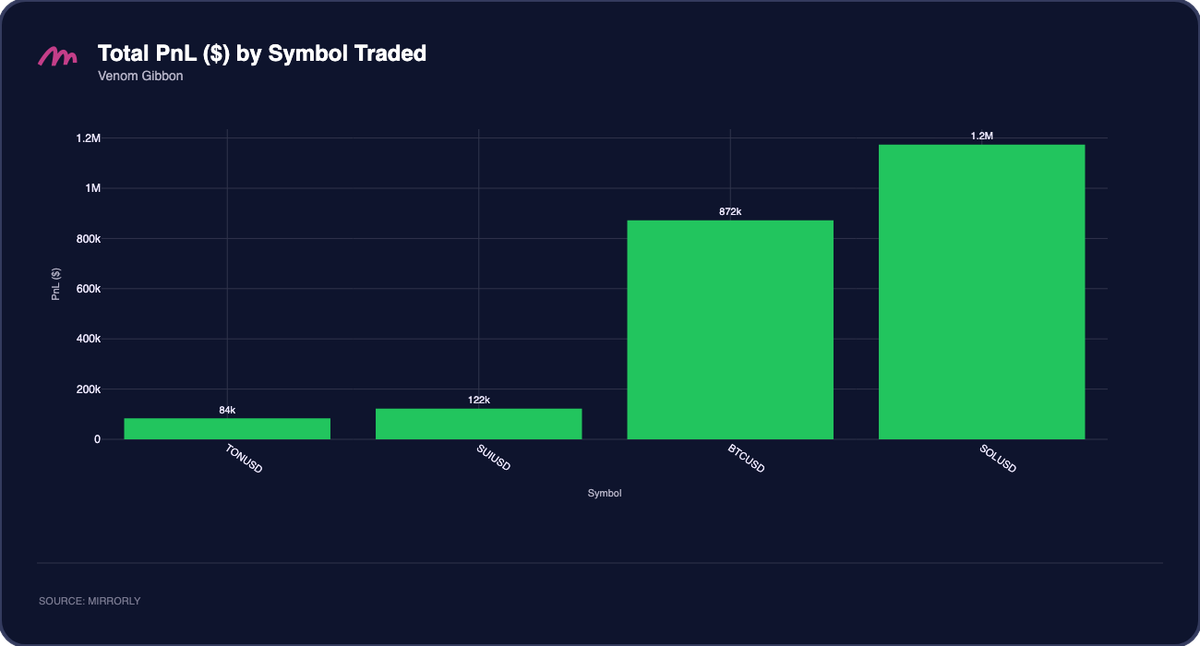
Venom Gibbon was profitable on every symbol shown. $SOL was the largest contributor at about +$1.2M, followed by $BTC at roughly +$872K. $SUI added about +$122K, and $TON contributed around +$84K. The absence of losing symbols is consistent with his high profit factor and small number of closed positions.
PnL Distribution#
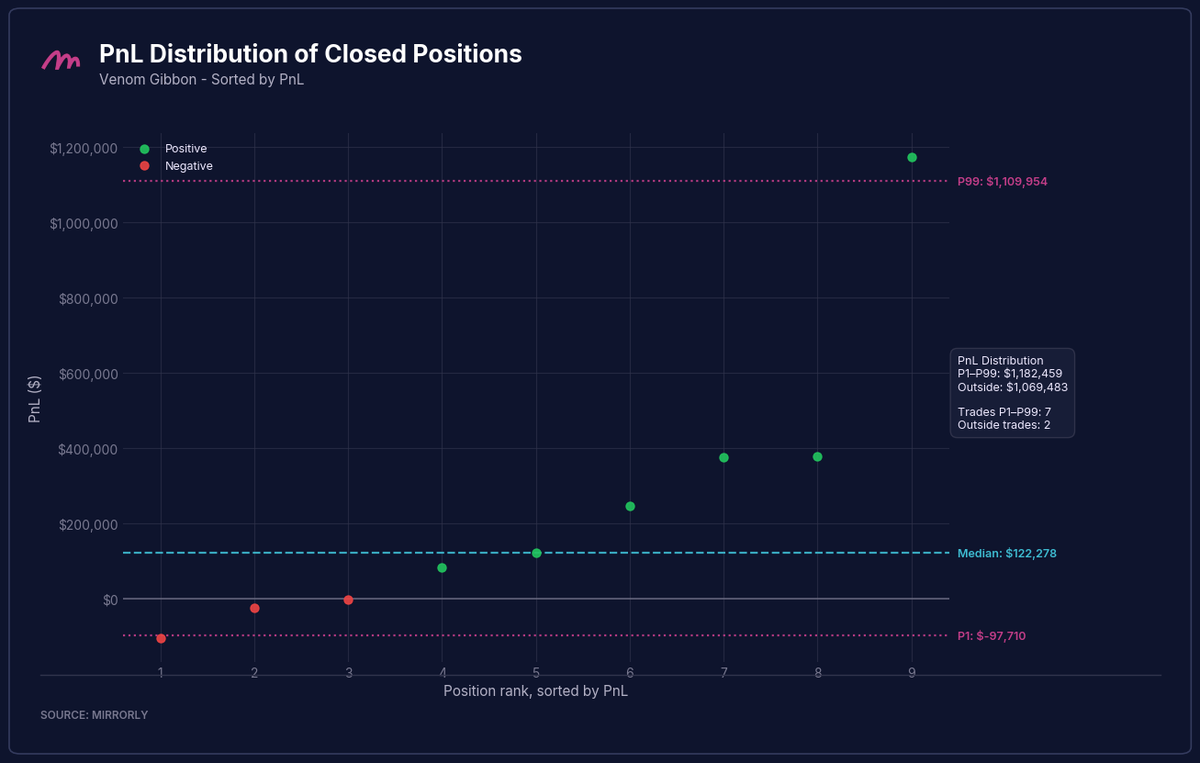
Venom Gibbon’s PnL distribution was the cleanest of the three. The median closed position was +$122.3K, the P99 level was about +$1.11M, and the P1 level was only -$97.7K. The 7 positions inside the P1 to P99 range generated +$1.18M, while the two outside positions added another +$1.07M. With only 9 positions closed, both the bulk of the distribution and the tail outcomes were positive in aggregate.
Case Study - Crystal Tasmanian’s HYPE Trend Capture#
Crystal Tasmanian’s May performance is a useful case study in how a trader can turn one strong market theme into most of a monthly result. The market overview showed $HYPE as the clear relative-strength asset of the month, finishing up roughly +82.4%, while $BTC, $ETH, and $SOL all ended negative. Crystal Tasmanian’s symbol-level PnL reflects that same dispersion: $HYPE contributed about +$2.5M, accounting for nearly all of his +$2.59M monthly profit.
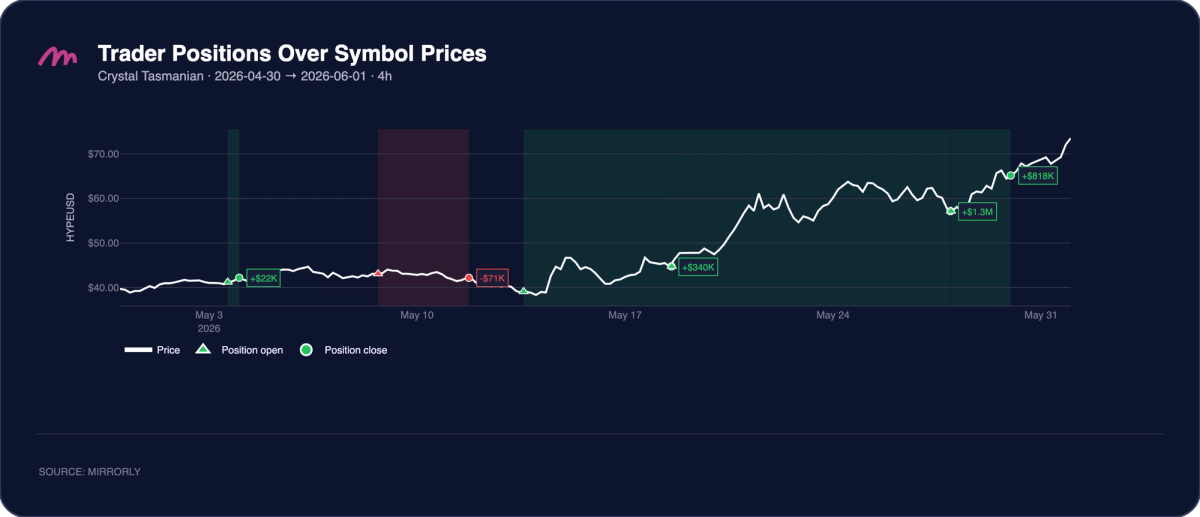
The full HYPE position overview shows three important episodes. Crystal Tasmanian first captured a small early-May HYPE move for about +$22K, then took a losing trade around May 8 to May 12 for roughly -$71K. The key difference came after that loss: instead of abandoning the theme, he re-entered as price reclaimed the high-$30s and held through the strongest part of the trend. That later sequence produced three major realized gains of approximately +$340K, +$1.3M, and +$818K.
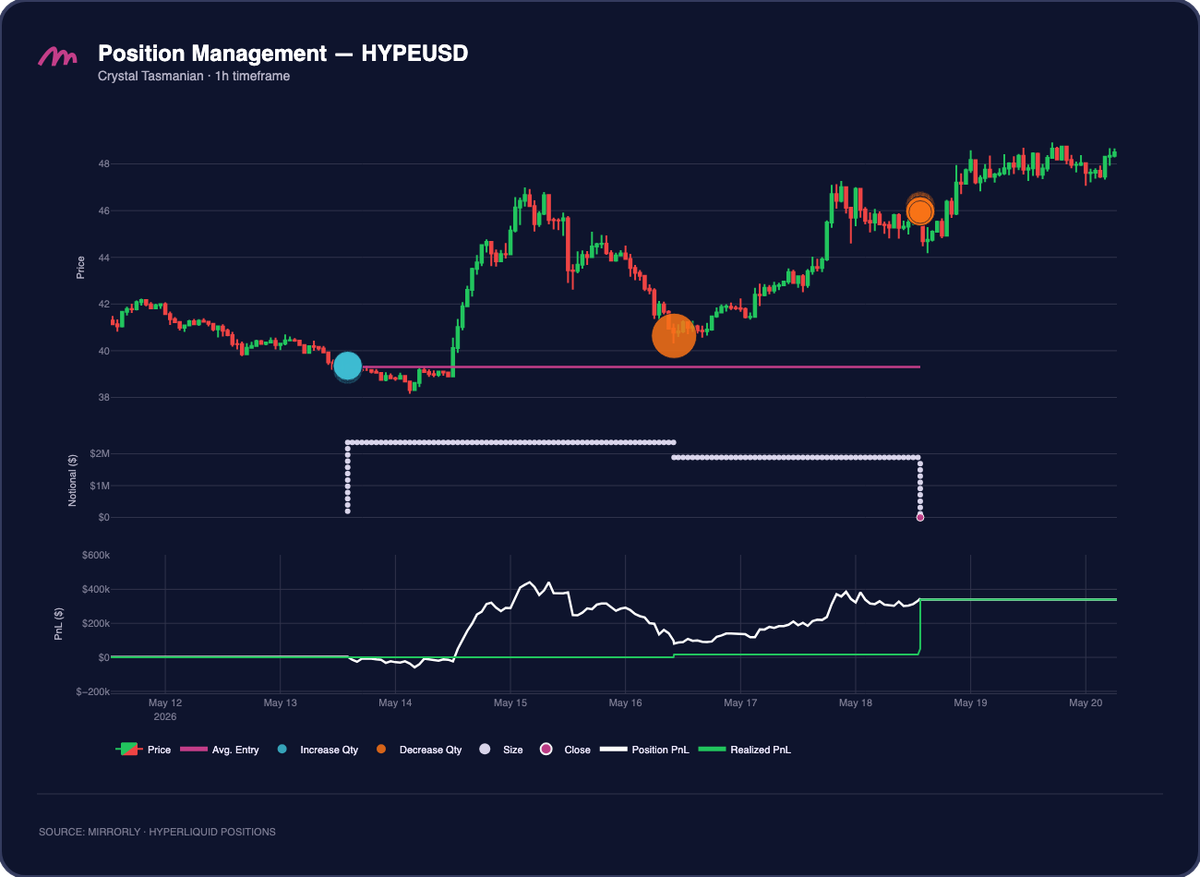
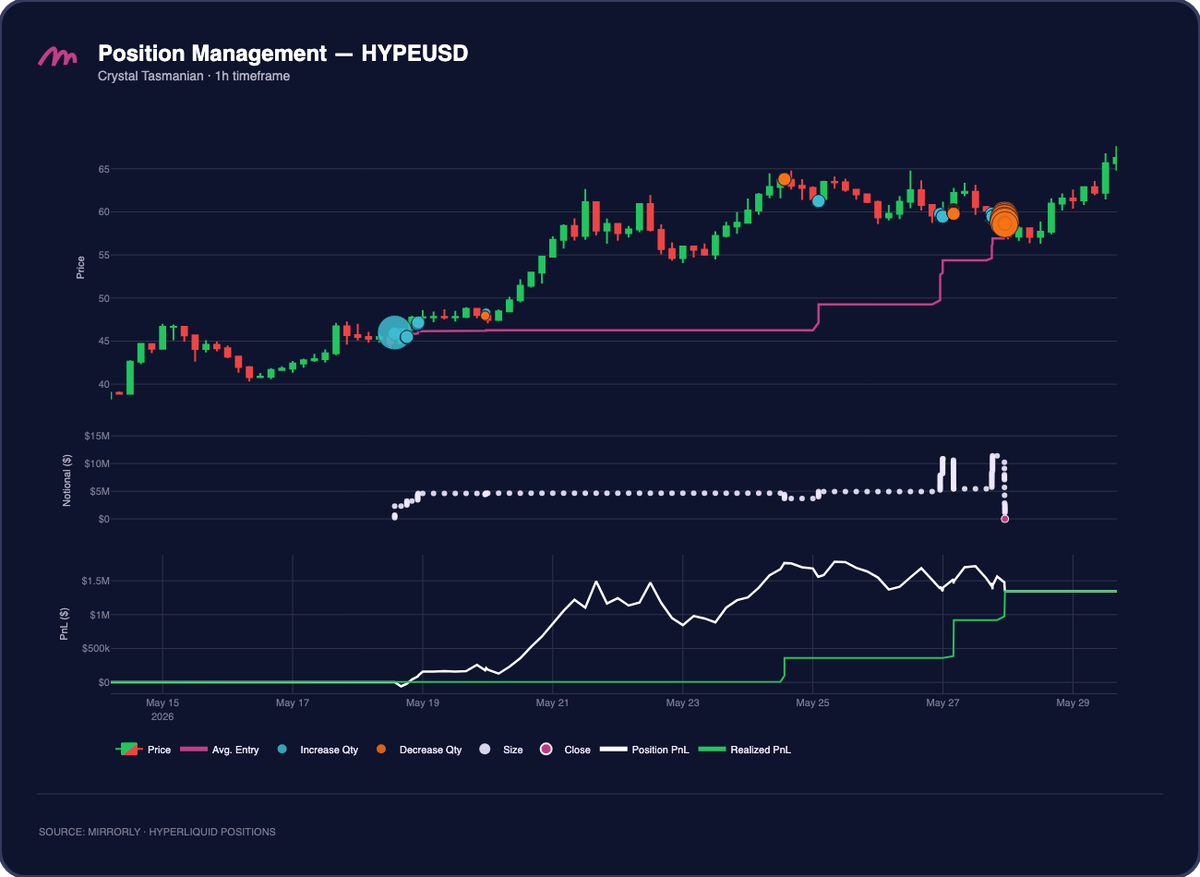
The first detailed HYPE trade shows the setup clearly. Crystal Tasmanian built a long position around the $39 to $40 area on May 13, with average entry marked near the local base. The position initially moved against him slightly, but price quickly recovered and rallied above $46 by May 15. He slightly reduced size as price retraced near his entry but eventually closed most of the the remaining exposure around May 18, realizing roughly +$340K.
The second HYPE trade was the largest contributor. He rebuilt exposure around May 19 near the mid-$40s, increased notional to roughly $5M, and held as HYPE moved through $50, $55, and eventually above $60. The position PnL reached more than +$1.5M at its peak before partial exits reduced the book. Realized PnL finished around +$1.3M, making this the core trade of the month.
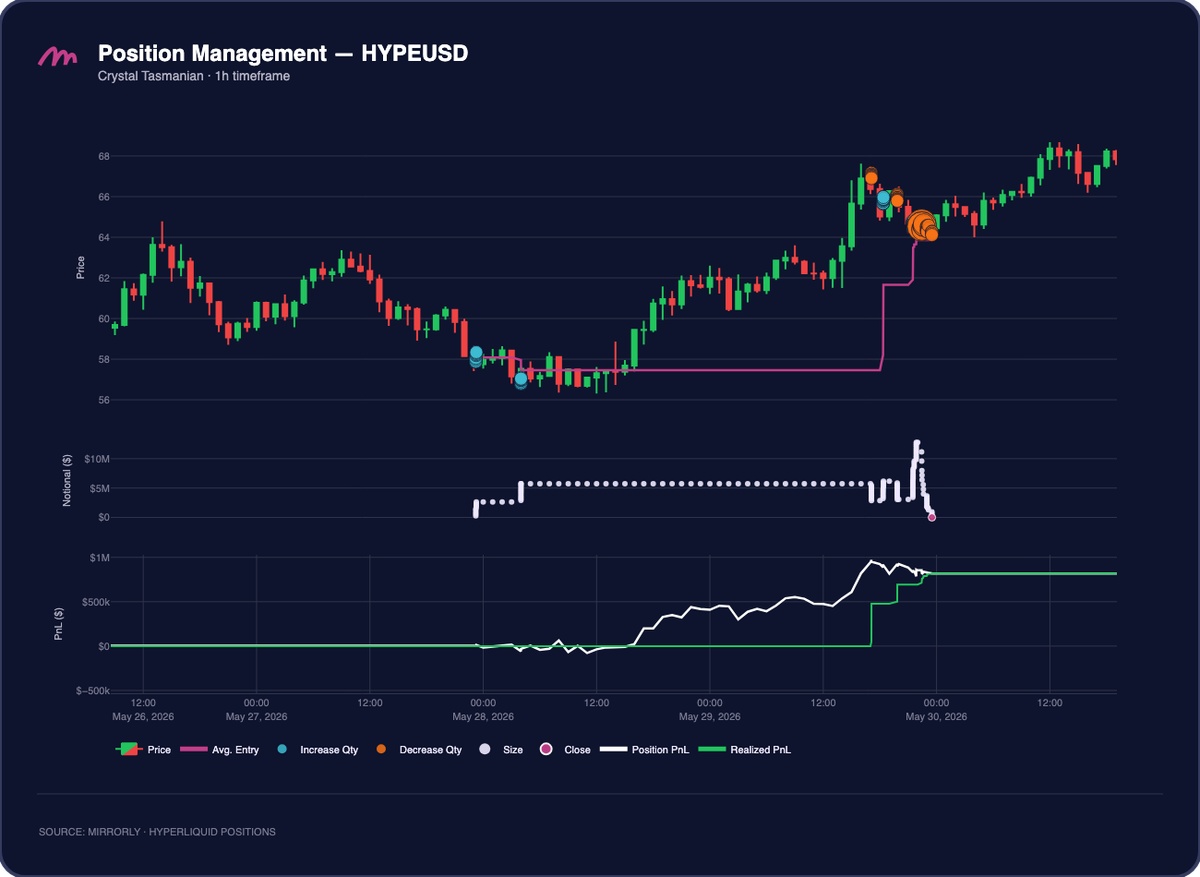
The third HYPE trade shows the same pattern on a shorter window near the end of the month. He entered around May 28 as price was consolidating near $57 to $58, scaled the position to roughly $5M to $6M notional, and held through a move toward the mid-$60s. He then reduced aggressively into the breakout and closed the position around May 30, realizing about +$818K.
For copy traders, the lesson is not simply that Crystal Tasmanian traded the strongest asset. The more important pattern is how the exposure was managed. Losing HYPE exposure was contained, while winning HYPE exposure was allowed to run for multiple days. This is consistent with his key metrics: average winners were held for 2 days and 8 hours, while average losers lasted only 12 hours, and the average win was more than five times the average loss.
Conclusion#
May’s top traders show that the strongest results came from selective exposure rather than broad market beta, with $HYPE creating the clearest opportunity while majors mostly finished negative. Shadow Wallaby recovered from a large mid-month drawdown, Crystal Tasmanian converted the $HYPE trend into a concentrated profit month, and Venom Gibbon delivered the cleanest distribution with every traded symbol ending positive.
Join Mirrorly: https://portal.mirrorly.xyz/
Subscribe to our Notifications so you don't miss next month's report!