
📢 The "Top Traders Monthly Report - Apr '24" is out now! 🚀
Featuring curated, consistently profitable traders from the Binance Leaderboard.
We'll reveal key stats and insights that distinguish top traders in this competitive arena.
Let's explore the trading elites! 💪
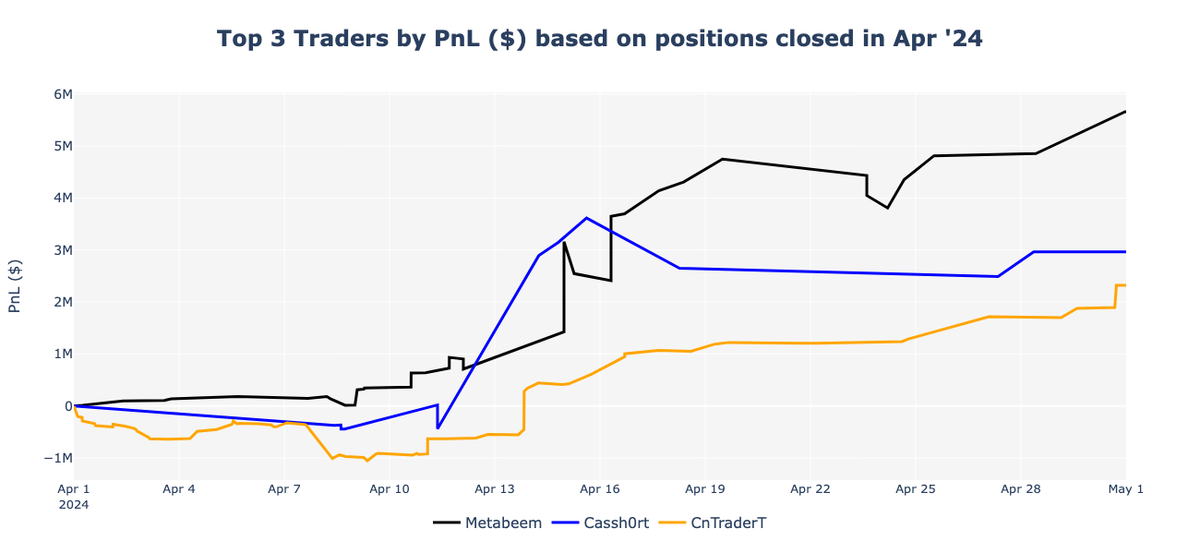
1️⃣ Top 3 Traders by PnL ($) - Overview#
April 2024 highlights its top three traders as follows:
🏆 Metabeem
🥈 Cassh0rt
🥉 CnTraderT (ApexTraderAlex)
Despite Bitcoin ($BTC) losing 15% in April, which impacted the broader crypto market, the top three traders for the month managed to achieve significant profits, ranging from $2.3 million to $5.7 million.
In first place, much like the previous month, Metabeem exhibited a consistent upward trend throughout April, surpassing the $5 million mark and closing the month with a total profit of $5.7 million. Cassh0rt, in second place, saw their PnL curve rise sharply after April 10th, peaking at almost $4 million before closing the month with a notable profit of approximately $2.9 million. Finally, CnTraderT, same place as previous month, experienced a gradual and steady increase in PnL. Despite starting with a slight dip into negative territory early in the month (-$0.9 million), this trader’s PnL consistently climbed, closing around $2.3 million.
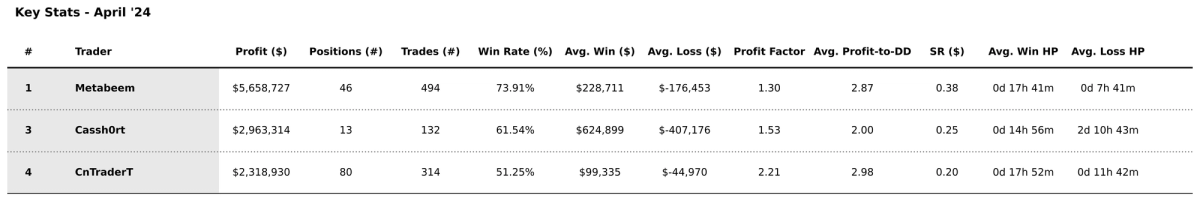
2️⃣ Top 3 Traders - Performance Metrics#
Metabeem closed a total of 46 positions, executing 494 trades with a notable 73.9% Win Rate, the highest among the three traders. The average holding period of his positions is intraday, with winning trades kept open more than twice as long as losing positions. Despite the lowest Profit Factor among the three traders (1.3), he shows a high average profit-to-drawdown ratio of 2.87.
Cassh0rt closed the fewest positions (13) this month resulting in a solid Win Rate of 61.5%. Notably, unlike the typical pattern observed in past reports where top traders hold winning trades longer than losing ones, Cassh0rt’s winning trades were held for an average of nearly 15 hours, while losing trades were held for over 2 days.
CnTraderT closed 80 positions in April, executing a total of 314 trades. He shows the highest Profit Factor at 2.21 and the highest average profit-to-drawdown ratio at 2.98. Like Metabeem, CnTraderT's average holding period is intraday, with winning positions held slightly longer than losing ones.
3️⃣ Trader Spotlight: Metabeem#
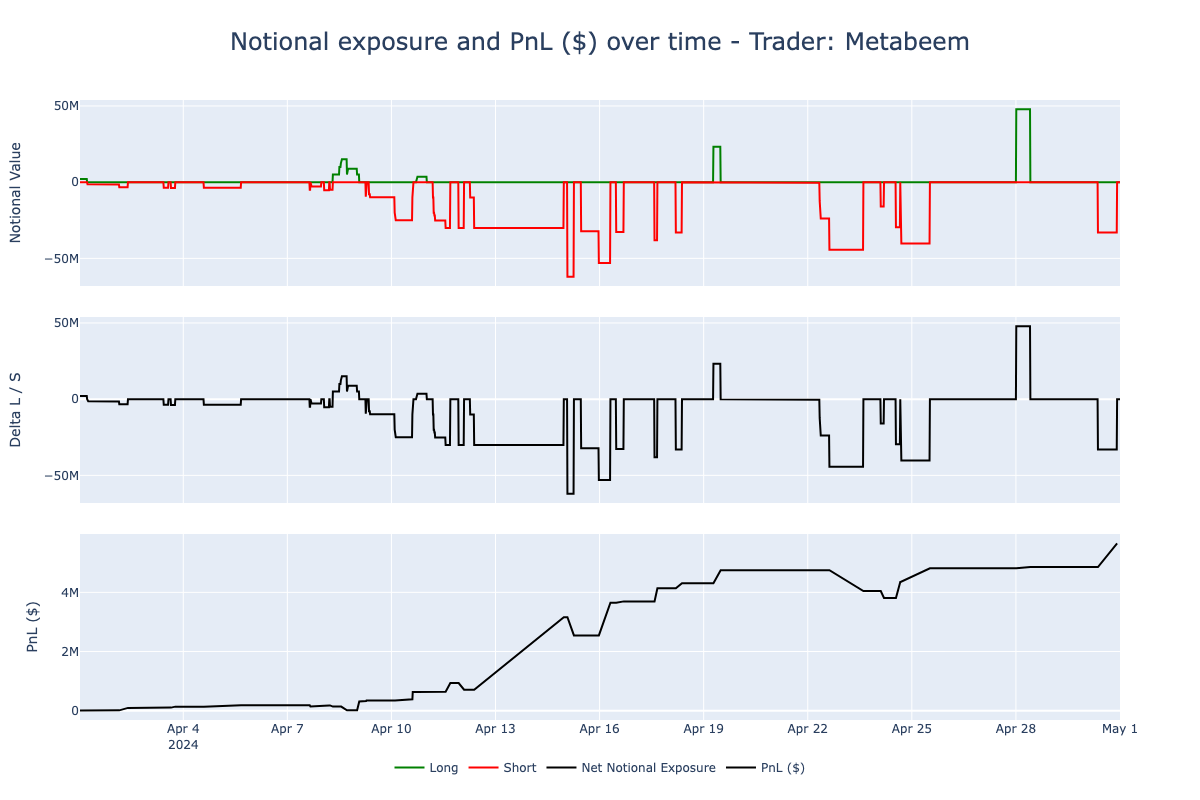
3.1. Notional exposure and PnL ($)#
Metabeem’s trading activity in April 2024 was predominantly short-biased, maintaining short positions for the majority of the month (85% shorts out of 46 positions). This trader’s strategy involved substantial position sizing, with notional values fluctuating between -$50 million and +$50 million.
Most of the profits were generated between April 13th and 19th, during which Metabeem maintained a deeply net short position, successfully capitalizing on the market decline.
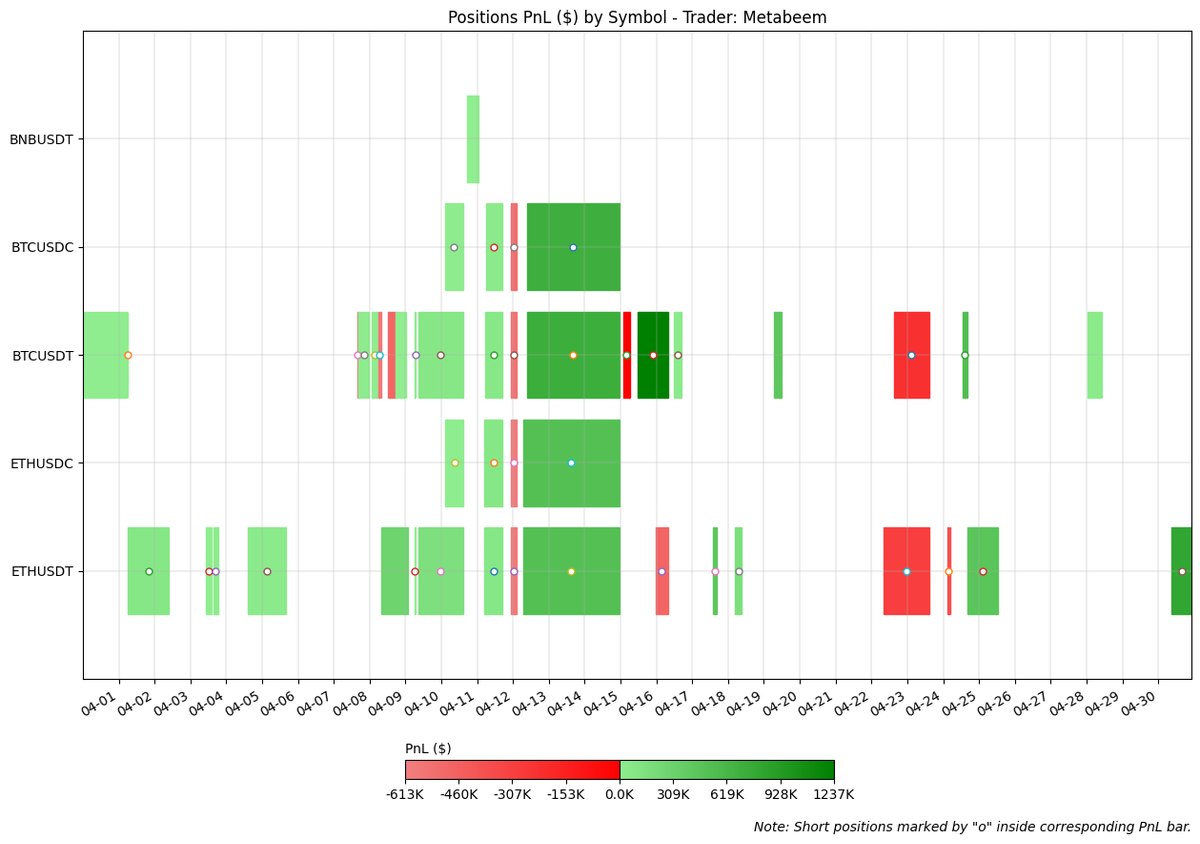
The figure below displays, for each closed position, the PnL ($) by symbol traded and their holding period.
Metabeem traded only three high-cap tokens, likely due to his large position sizes: $BTC, $ETH, and $BNB.
The figure below displays the TotalPnL ($) by symbol traded.
The cumulative distribution function (CdF) of his PnL is slightly positively skewed (skewness: 1.05), with a positive edge since 65th percentile:
- 25th percentile: W/L ratio of 0.53 ($21.2k vs $-40.2k)
- 75th percentile: W/L ratio of 1.71 ($442k vs $-258k)
3.2. Position Case Studies#
ETHUSDT - The importance of position sizing#
As shown in the image above of the positions PnL by Symbol, Metabeem primarily traded the two major crypto tokens, $BTC and $ETH, against $USDT and $USDC during April. His positions in these tokens were almost synchronized. The chart below illustrates all the trades he made on the ETHUSDT pair, which brought him the highest cumulative profit of $2.4 million.
- This chart provides a comprehensive view of all trades, different position sizes, and the frequency of trades throughout the month. It is evident that most trades were closed quickly and contributed minimally to the total PnL, while a few significant trades generated substantial profits. The chart highlights the best and worst trades on $ETH by PnL and the best trade by Return on Investment (ROI%).
- The best trade by ROI (highlighted in green on the left) achieved a +10% return, generating a profit of $516k with a notional exposure of approximately $5 million. In contrast, the best trade by PnL (highlighted in green on the right) earned a profit of $800k with a ROI of just +2.4%, but the notional exposure was significantly larger at $33 million.
- Conversely, the worst trade by PnL (highlighted in red) resulted in a loss of $316k, although with a ROI of just -1.3%, however with a notional size of $23.8 million. This analysis underscores the importance of position sizing and conviction in a trade to achieve impactful profits. As recently highlighted by @JoshuaDeuk in a tweet (https://x.com/JoshuaDeuk/status/1791677487216509414), having strong conviction and appropriate sizing in trades can make a significant difference in overall performance:
- “Each cycle I learnt a few things about trade and learnt to trade how I trade now. And yes Sizing matters the most It's all about sizing 2nd is understanding where we are in the market 3rd is picking the right product After three cycles, the above three are what I think matter the most Keep it simple and stupid”
4️⃣ Trader Spotlight: Cassh0rt#
4.1. Notional exposure and PnL ($)#
Similarly to Metabeem, Cassh0rt maintained a net short notional exposure throughout April. Most of his profits were derived from a short position on $ETH between April 12th and 13th, with a maximum notional of $17.4 million, which earned him $2.9 million and contributed 41% to his total PnL.
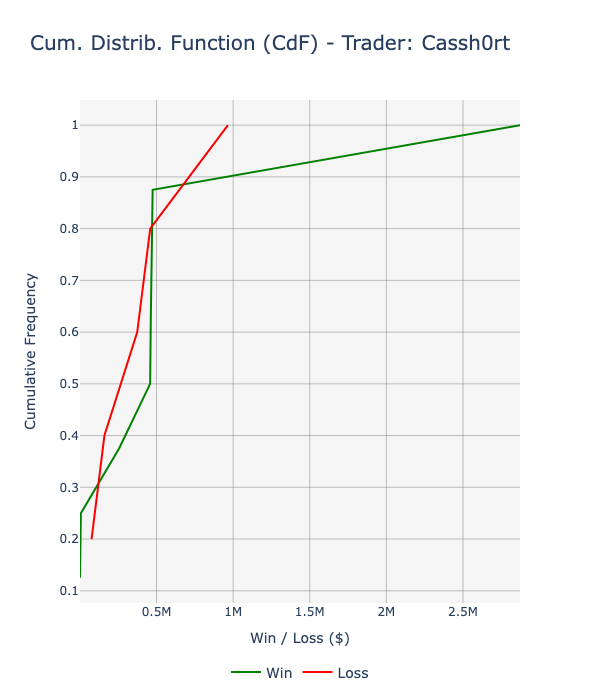
- Cassh0rt’s notional exposure fluctuated between -$17 million and +$21 million. Like Metabeem, he frequently shifted his positions between long and short without ever hedging his portfolio. The figure below displays, for each closed position in April ‘24, the PnL ($) by symbol traded and their holding period. The figure below displays the TotalPnL ($) by symbol traded. The cumulative distribution function (CdF) of his PnL is positively skewed (skewness: 1.9), with a positive edge since lower percentiles, with one exception between 80th and 90th::
- 25th percentile: W/L ratio of 1.21 ($193.5k vs $-160k)
- 50th percentile: W/L ratio of 1.23 ($460k vs $-374k)
- 75th percentile: W/L ratio of 1.02 ($470k vs $-459k)
4.2. Position Case Studies#
ETHUSDT - Having conviction#
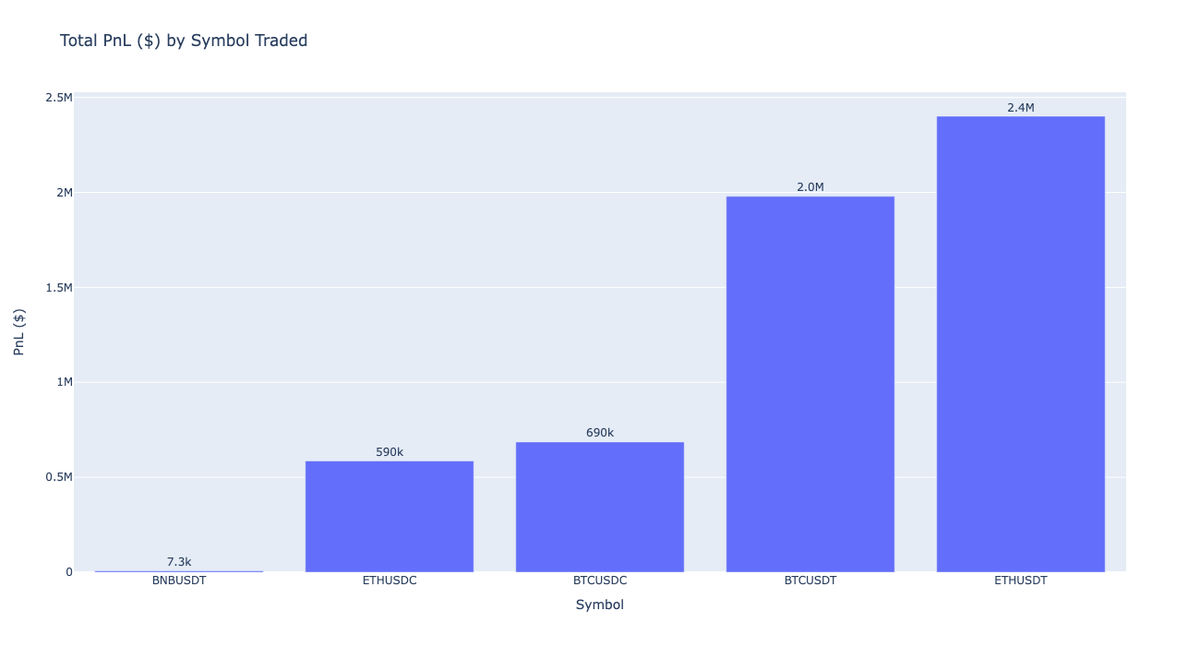
Similar to Metabeem, Cassh0rt also traded only a few symbols during April, with $ETH contributing the majority of profits to his total PnL ($3.2 million).
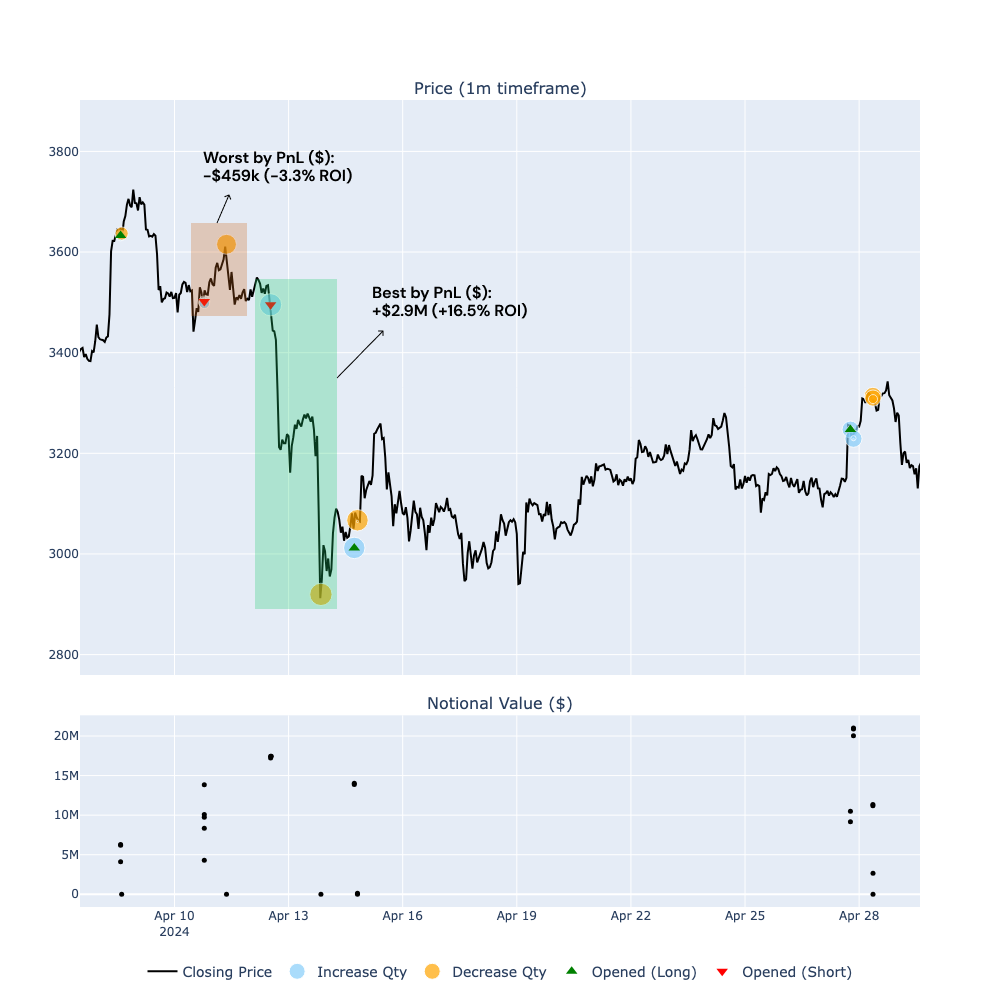
Out of a total of five positions, the chart below highlights the most profitable trade, which contributed approximately 40.8% to his PnL. This trade yielded a profit of $2.9 million with a notional value of $17.4 million (ROI of 16.5%).
Conversely, the chart also shows his only losing trade, which resulted in a loss of $459k, contributing -6.5% to the total PnL with a notional value of $13.8 million (ROI of -3.3%). For reference, the PnL of the other three trades ranged between +$6.4k and +$475k.
It's worth noting that Cassh0rt's worst and best trades occurred consecutively. On April 10th, Cassh0rt held a short position of $13.8 million but closed it on April 11th with a loss. The day after, he reopened a larger short position of $17.4 million. This decision paid off, as he closed the position on April 13th with a profit that was 6.3 times the previous loss
5️⃣ Trader Spotlight: CnTraderT#
5.1. Notional exposure and PnL ($)#
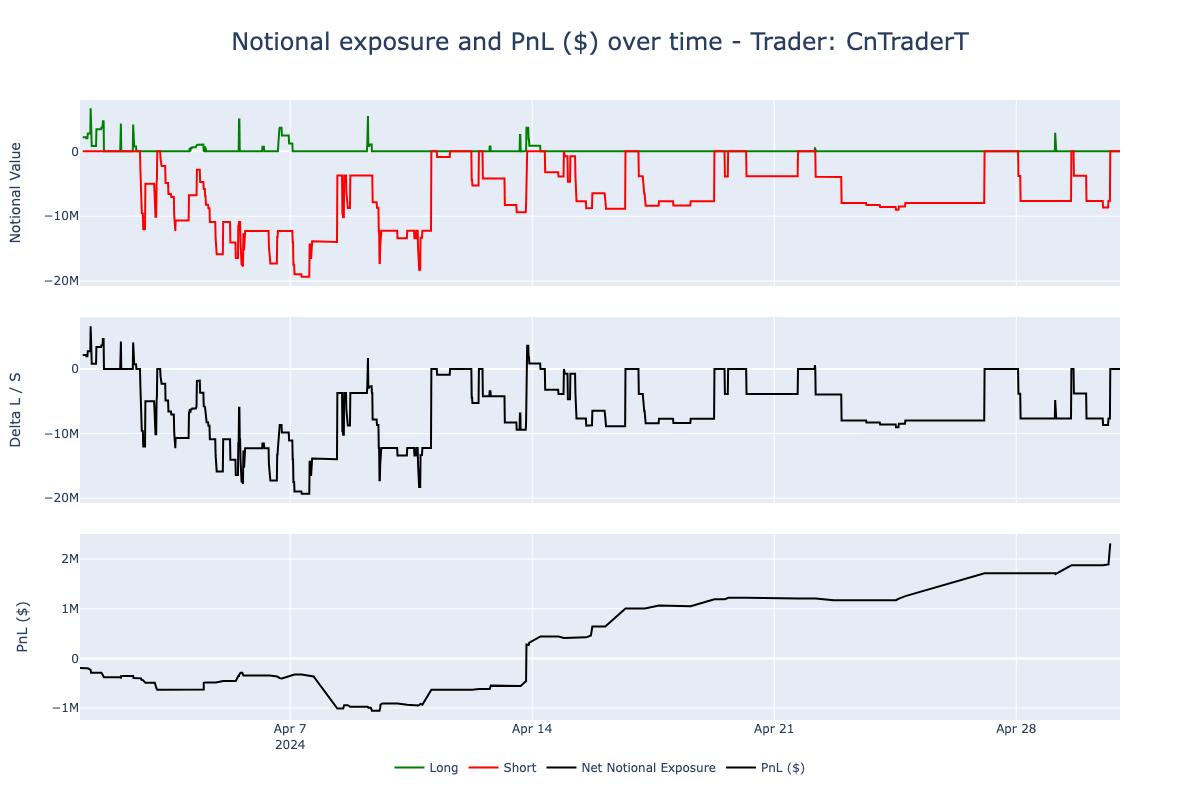
CnTraderT also maintained a large short exposure throughout the month. Unlike the other two traders, CnTraderT began taking positions at the start of April. Initially, this strategy faced challenges when $BTC bounced back about 9% between April 3rd and 8th, causing CnTraderT to be underwater by nearly $1 million.
However, once $BTC started its sustained downtrend, CnTraderT quickly recovered his losses. From mid-April onwards, his PnL curve consistently moved upward, culminating in a total profit of $2.3 million by the end of the month.
In terms of notional exposure, CnTraderT maintained an average short exposure of $10 million, peaking around $20 million. On the long side, he was much more conservative, with a maximum exposure of $5.8 million.
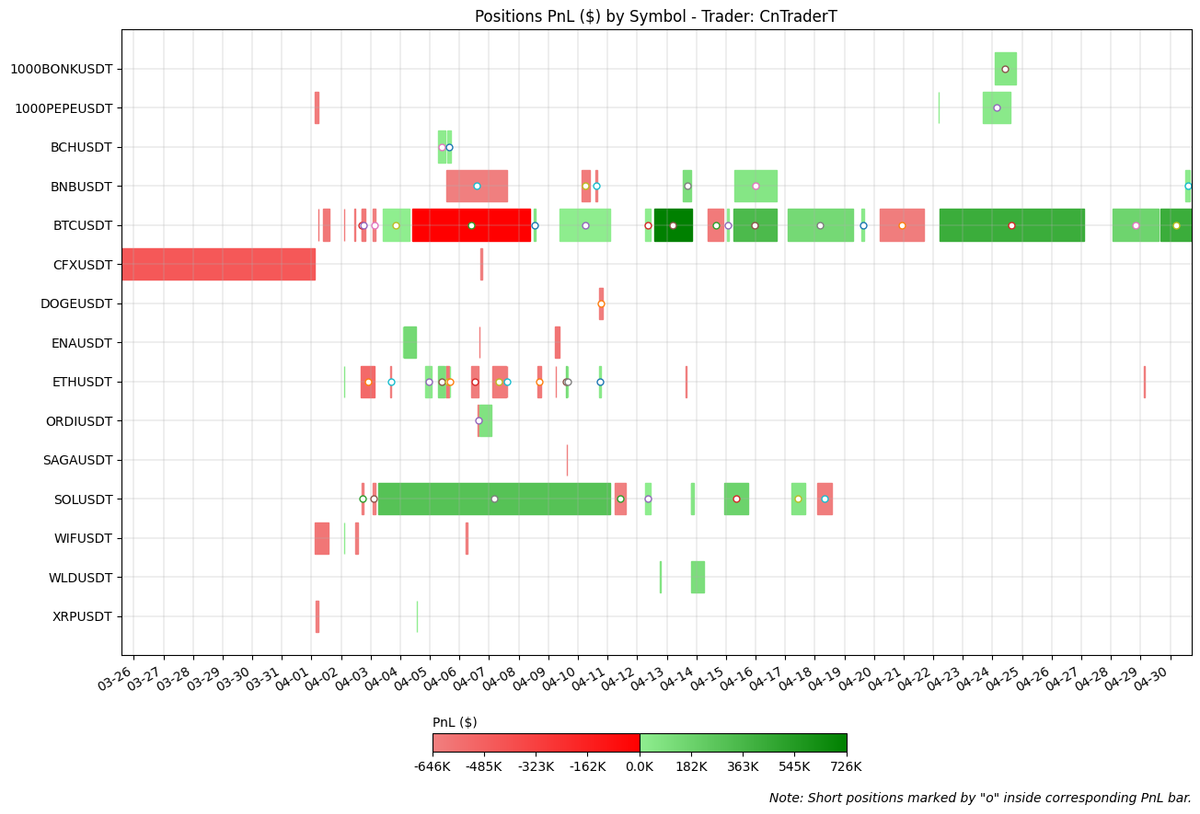
The figure below displays, for each closed position in April ‘24, the PnL ($) by symbol traded and their holding period.
Among the three traders, CnTraderT diversified the most across different tokens, spreading his positions across various categories and narratives. Despite this diversification, the majority of his positioning was based on $BTC.
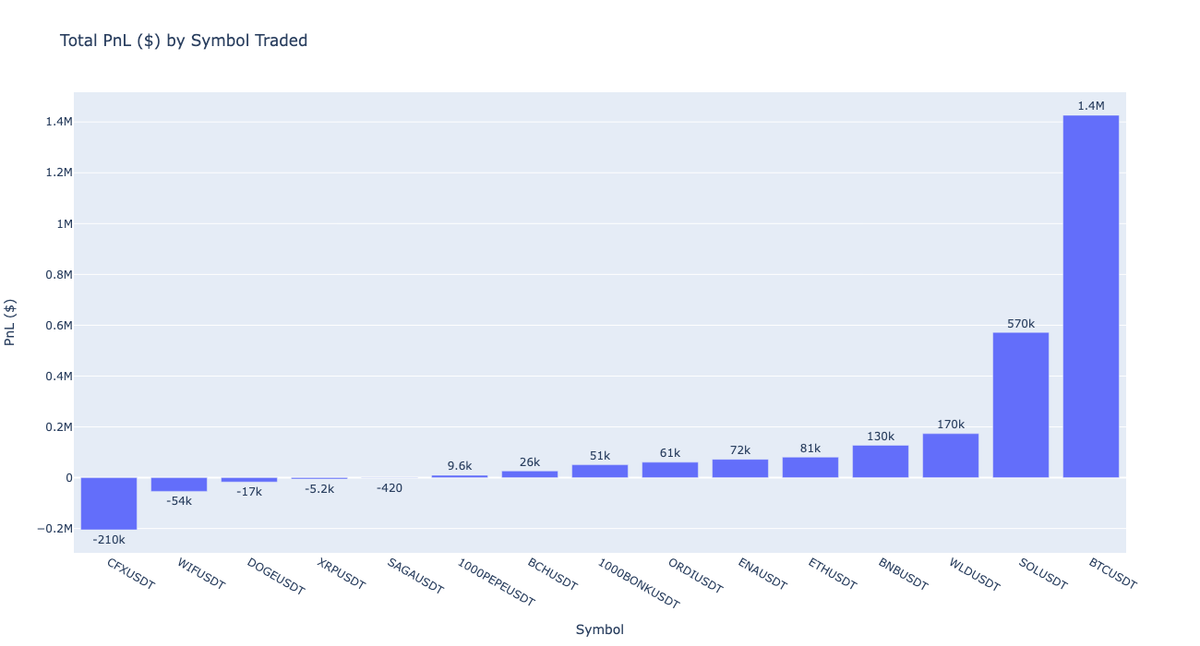
The figure below displays the TotalPnL ($) by symbol traded.
The cumulative distribution function (CdF) of his PnL is positively skewed (skewness: +0.79), with a positive edge since lower percentiles:
- 25th percentile: W/L ratio of 1.12 ($11.3k vs $-10.1k)
- 25th percentile: W/L ratio of 2.57 ($44.2k vs $-17.2k)
- 75th percentile: W/L ratio of 2.86 ($104k vs $-36.4k)
5.2. Position Case Studies#
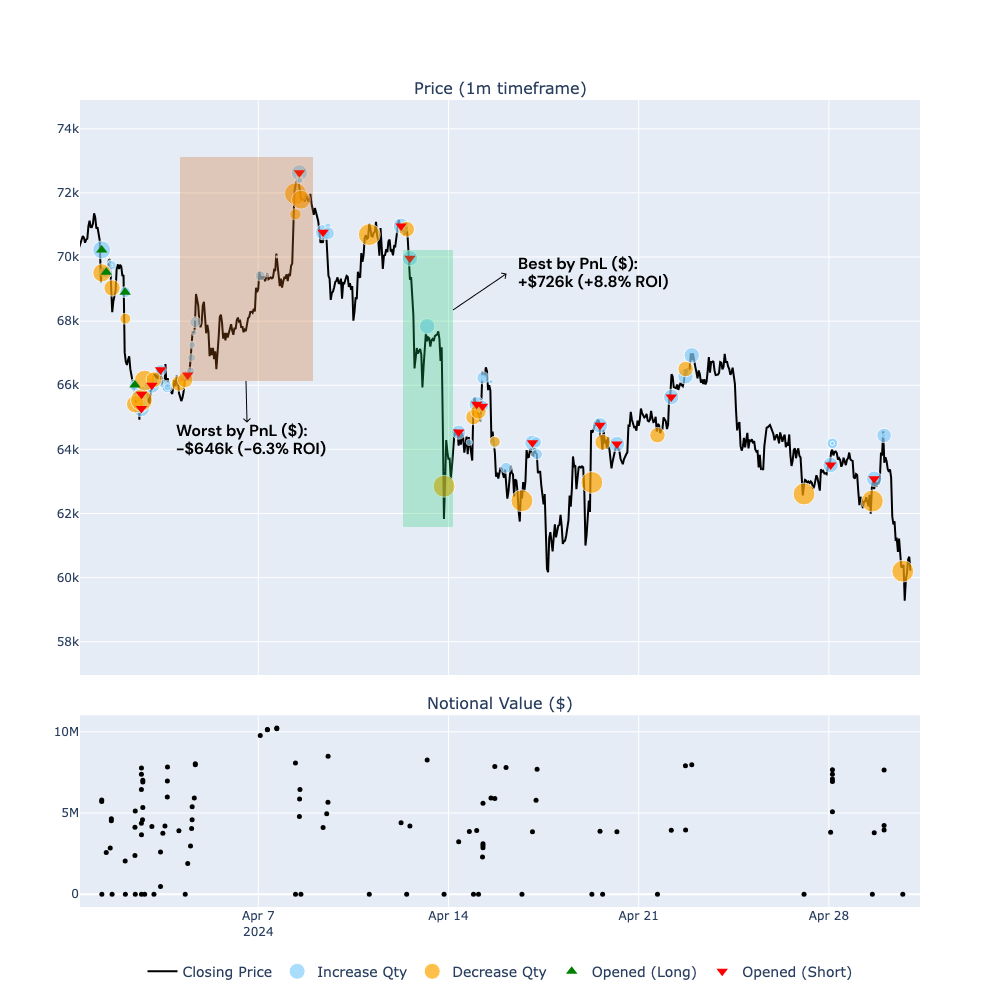
BTCUSDT - Changing Bias Quickly#
CnTraderT traded the most crypto tokens during April, yet most of his profits came from $BTC, yielding a cumulative gain of $1.4 million. He executed 22 positions in $BTC, as shown in the chart below. At the beginning of the month, his bias was long (indicated by green triangle markers pointing up), but he soon switched to a short bias, which he maintained until the end of the month. The chart shows that most positions were short-lived, with trades opened and closed very quickly.
For reference, 15 out of the 22 positions each contributed less than 2% to his total PnL. The chart highlights the worst and best trades by PnL.
The losing trade, a short position, contributed -11% to his total PnL. He opened this position on April 4th and, as the price of $BTC started bouncing, CnTraderT gradually increased his position to average up the entry price, reaching a notional of $10.2 million. He eventually closed the position with a loss of $646k (ROI of -6.3%).
On the winning position, he achieved a profit of $726k (ROI of +8.8%) with a notional of $8.3 million, contributing 12.5% to his total PnL.
6️⃣ Conclusion#
The top three traders of the month exhibited a largely short-biased approach and traded with substantial position sizes. Consequently, their PnL curves followed a similar pattern, with significant increases and peaks occurring between April 10th and 18th. Their trading styles were also alike in terms of holding periods, which were predominantly intraday on average.
One crucial takeaway is the importance of proper position sizing in high-conviction trades. At least for these traders, this was essential for making a meaningful impact on PnL, as only a few trades contributed to the majority of the total PnL.
Stay connected for more insights in the upcoming month's edition.
Follow our highlight traders on Twitter:
Metabeem: please if you know, let us know his twitter handle
Cassh0rt: https://x.com/Cassh0rt
CnTraderT: please if you know, let us know his twitter handle
Data analysis provided by@0xfab_eth. Drop him a follow!
BETA ACCESS:https://portal.mirrorly.xyz/beta-application?referralCode=0xfab
Subscribe to our Notifications so you don't miss next month's report!