Quarterly Insight - Q2 2026#
"Conviction over churn: the quarter's biggest gains came from the fewest trades."
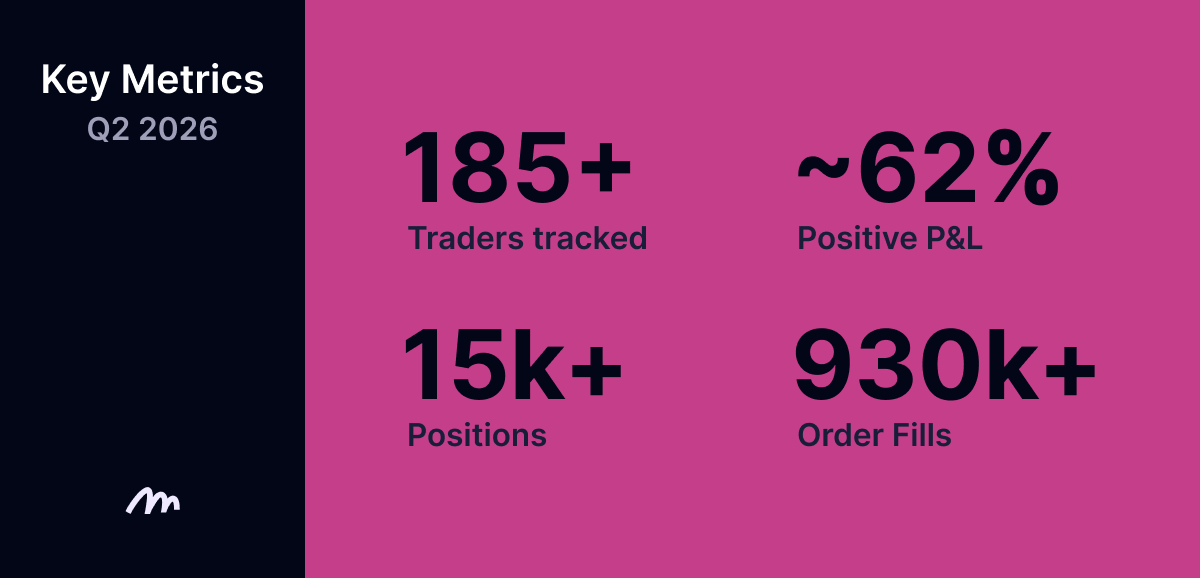
In Q2 2026, Mirrorly tracked over 185 traders across Hyperliquid and Binance Smart Money. The quarter traded as wide two-way chop rather than a single directional crash, and about 62% of tracked traders finished profitable, up from the 55% that survived Q1's broad drawdown. Over the period, the platform recorded more than 15k closed positions and over 930k individual order fills. Every figure in this report is realized PnL on closed positions. Open positions are excluded, so the numbers reflect what these traders booked, not paper gains.
Market Overview#
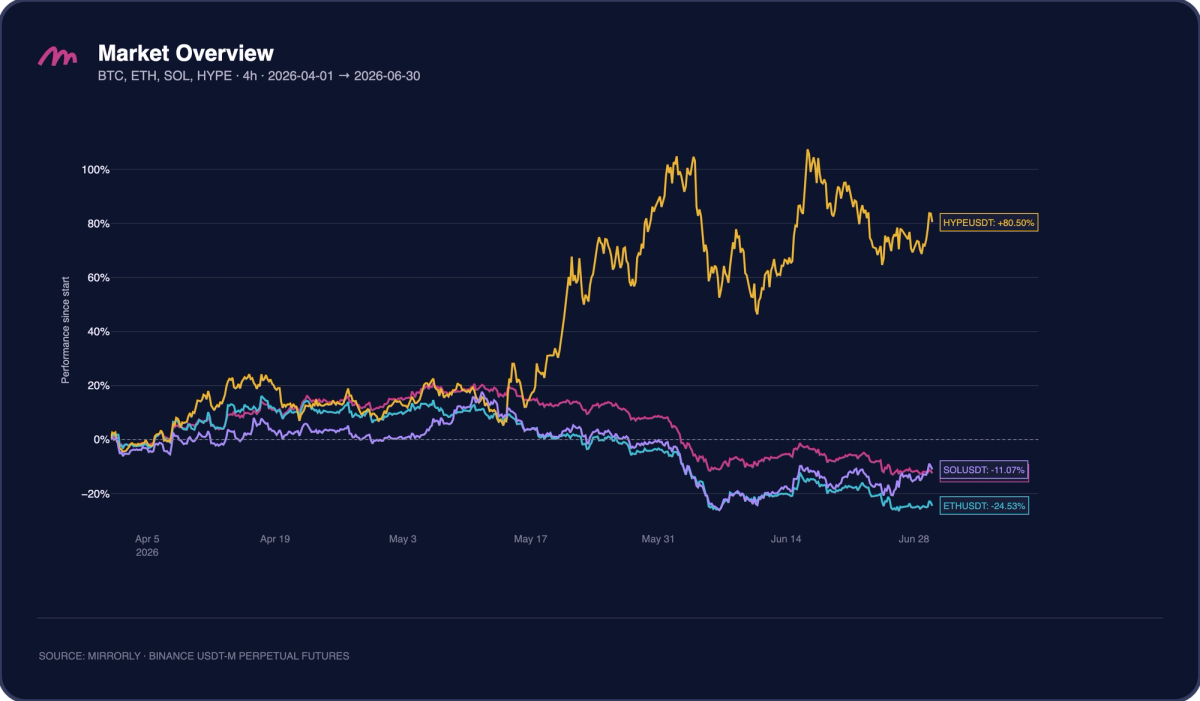
Where Q1 was a straight-line drawdown across nearly all majors, Q2 2026 was a choppy, range-bound quarter with a wide two-way profile. Most assets rallied into early May, reaching roughly +20% before rolling over sharply through the back half of the quarter and grinding sideways to lower into quarter end.
$ETH was the weakest major, down 24.5% on the quarter, with $BTC close behind at -12.53% and $SOL at -11.07%. As in Q1, $HYPE was the outlier, up 80.5%, running past +100% twice through May and June before pulling back into a still-commanding gain.
Traders who leaned short in the weakest majors and long in the few names that were working had far more room to operate than those holding directional exposure through the mid-quarter reversal. The rest of this report focuses on the ten traders with the highest realized PnL on the Mirrorly leaderboard during Q2 2026, based on all traders tracked over the period.
Top Performers of the Quarter#
The most striking feature of Q2 is the width of the dispersion at the top. Where Q1's top ten clustered between $2.0M and $3.0M, Q2's leaders ranged from $1.36M to $10.27M, with the top three alone generating more than $22M in realized PnL, nearly triple the equivalent Q1 figure.
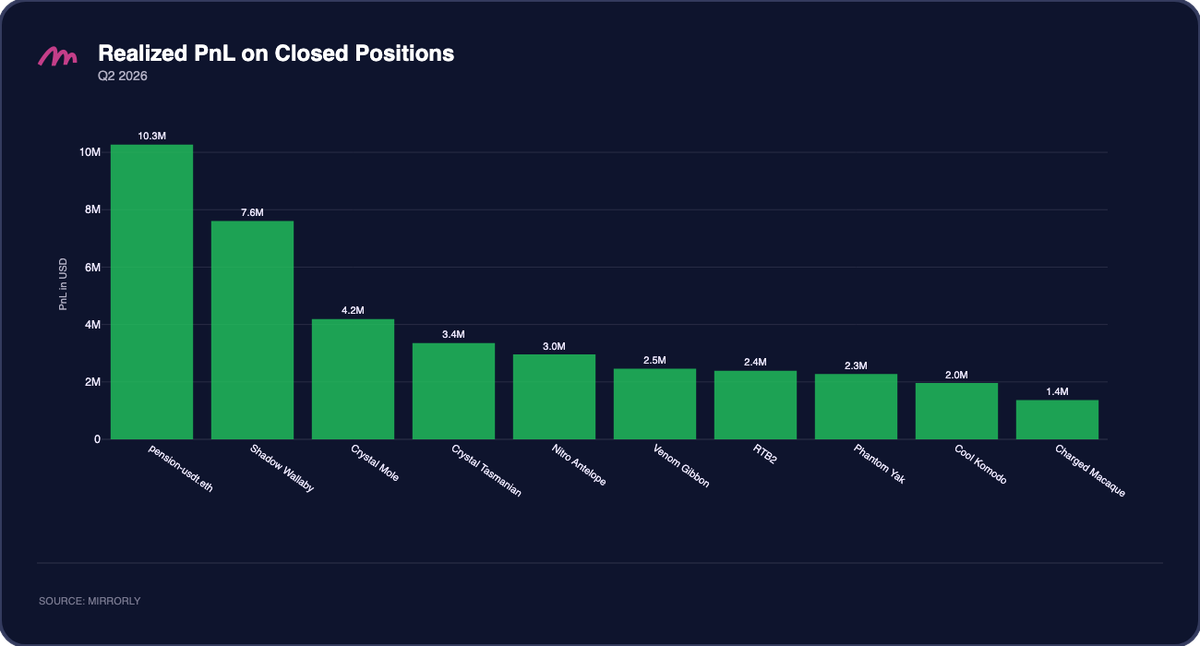
pension-usdt.eth led the entire leaderboard with $10.27M from 3 positions and 6 total trades, posting a 100% win rate with an average winner of $3.42M held for over 45 days. It is the most concentrated result in the group. Shadow Wallaby ranked second with $7.60M through the opposite approach: 72 positions across 19.5k trades at a 79.2% win rate and a 1.91 profit factor. Crystal Mole took third with $4.19M from 4 positions, pairing a 50% win rate with a 285.65 profit factor and average holding periods beyond 125 days.
The ten traders reached the same result through very different methods. Win rates ran from 35.7% (RTB2) to a cluster of 100% low-frequency names (pension-usdt.eth, Nitro Antelope, Cool Komodo), and profit factors from 1.71 (Phantom Yak) to unbounded for the traders who closed no losers. RTB2 is the counterpoint that matters: it won only 35.7% of 14 positions, yet booked $2.39M because its average winner ($658K) ran about 6.5 times its average loser ($100K), a profit factor of 3.65.
The dispersion in holding periods and trading intensity is equally wide. At one extreme, pension-usdt.eth and Nitro Antelope closed only 3 and 2 positions respectively across the entire quarter, holding winners for 45 to over 90 days. At the other, Phantom Yak ran 175 positions across 10.3k trades, and Shadow Wallaby turned over 19.5k trades. Both high-volume traders finished with over $2.2M, but did so by compounding many small edges rather than sitting in a handful of large ones.
Risk-adjusted quality separates the group further. Crystal Mole posted the highest average profit-to-drawdown ratio at 11.20, ahead of Venom Gibbon (6.39) and Charged Macaque (4.34), a sign of strong returns relative to the heat taken while positions stayed open. The highest-turnover books (Shadow Wallaby, Phantom Yak) carried the lowest Sharpe ratios in the group (0.16 and 0.10). They produced large PnL over a choppy equity curve.
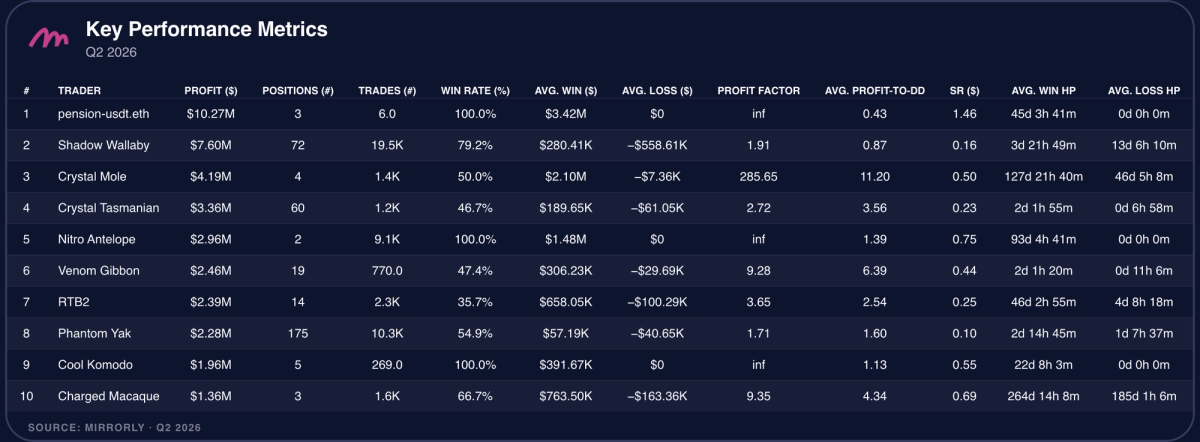
The Q2 leaders reached top-tier profitability from opposite ends of the frequency spectrum, from three-position conviction holds to five-figure trade counts. For Mirrorly copytraders, that argues for spreading exposure across complementary trader profiles rather than a single execution style.
Where the Capital Was Deployed#
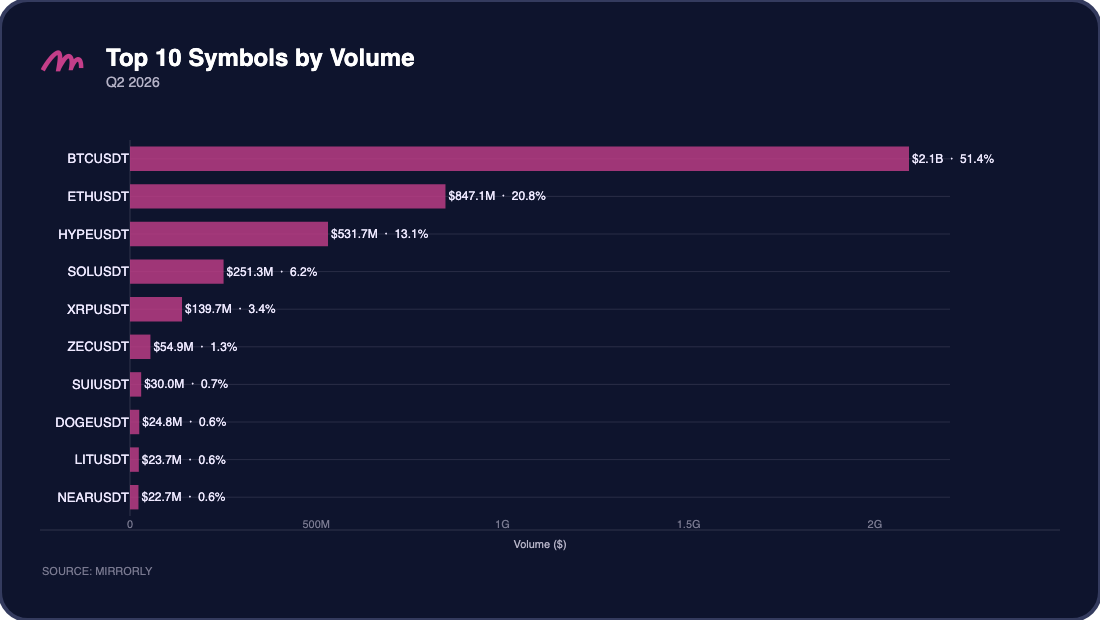
Trading activity in Q2 stayed concentrated in the largest markets, led by $BTC. $BTC was the most-traded market at $2.1B in volume (51.4%), ahead of $ETH at $847.1M (20.8%) and $HYPE at $531.7M (13.1%). Those three carried about 85% of all volume. $BTC still dominated the order flow as it did in Q1. Note that with only 185 traders in the sample, these shares are sensitive to a handful of large accounts, so a few whales rotating size into $ETH and $HYPE can move the volume mix as much as any broad shift in behavior.
Beyond the top three, activity fell off: $SOL ($251.3M, 6.2%), $XRP ($139.7M, 3.4%), $ZEC ($54.9M), $SUI ($30.0M), $DOGE ($24.8M), $LIT ($23.7M), and $NEAR ($22.7M) rounded out the top ten.
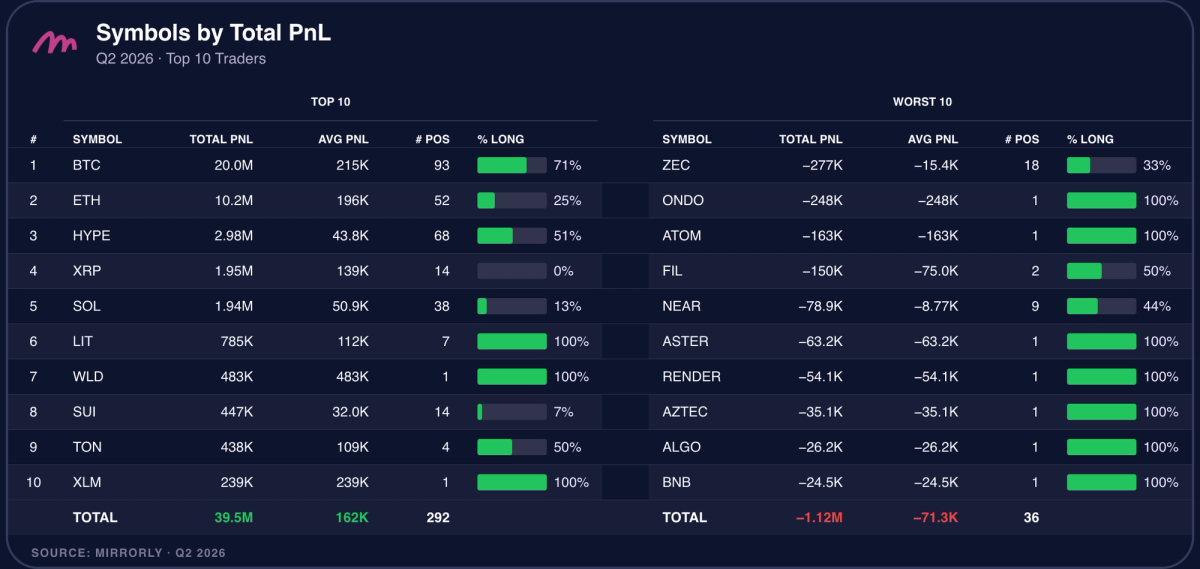
By realized PnL the ranking held. $BTC was the single largest profit source, generating $20.0M across 93 positions, more than half of all positive PnL, despite finishing the quarter down 12.53%. $ETH followed at $10.2M across 52 positions, and $HYPE contributed $2.98M across 68 positions. Together with $XRP ($1.95M) and $SOL ($1.94M), the top five symbols accounted for roughly $37.1M, about 94% of all positive PnL in the group.
Position direction shows how flat and falling assets still produced most of the profit. The traders ran $BTC 71% long, working the two-way range from the long side, and leaned short in the weakest majors: $ETH sat at 25% long, $SOL at 13% long, and $XRP at 0% long (fully short). They kept $HYPE, the quarter's strongest asset, at 51% long.
Losses stayed contained. The worst-ten symbols together lost $1.12M across 36 positions, led by $ZEC (-$277K across 18 positions) and $ONDO (-$248K on a single position). Those losses ran an order of magnitude below the gains, and most of the worst symbols were single-position misfires rather than repeated bleeding.
How Returns Were Generated#
Measured by profit per unit of exposure, the low-frequency operators were the most capital-efficient. Charged Macaque led at $0.14 of PnL per $1 of volume, ahead of Nitro Antelope at $0.09 and Cool Komodo at $0.05, all of them low-frequency, long-hold books. Crystal Mole and RTB2 clustered near $0.04. pension-usdt.eth topped the absolute PnL leaderboard yet registered $0.02, given the size of the notional behind its three positions.
At the bottom of the efficiency spectrum sat the high-turnover books. Shadow Wallaby and Venom Gibbon registered close to $0.01 per $1, and Phantom Yak and Crystal Tasmanian rounded toward $0.00, reflecting very high volume relative to realized gains.
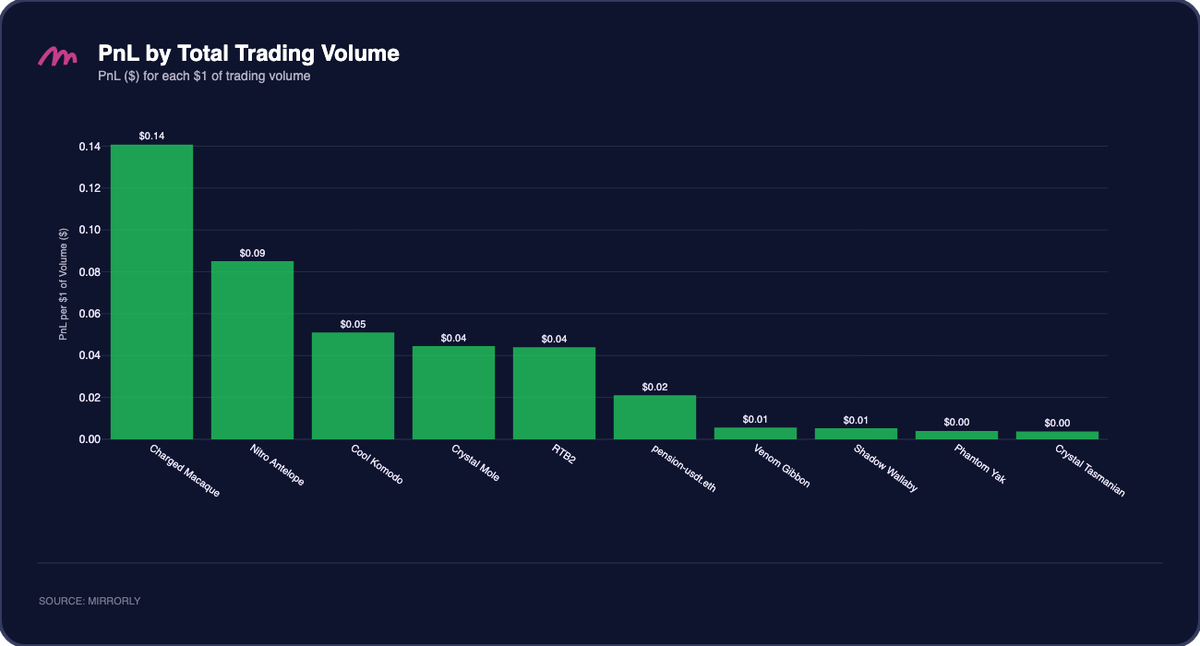
For Mirrorly copytraders, these differences matter. A higher PnL-per-Volume ratio does not by itself make a trader better or worse, since traders at both ends of the range booked similar or larger absolute PnL. But lower ratios leave less room for execution costs and slippage, because fees and spread eat a larger share of gross returns. That matters most in copy-trading, where added latency erodes the edge of a high-turnover strategy more than a concentrated, low-frequency one.
Conclusion#
Q2 2026 was a quarter of wide chop rather than clean trend. $ETH finished down 24.5%, $BTC down 12.53%, $SOL down 11.07%, and $HYPE up 80.5%, with most assets rallying into May before reversing hard. In that market, about 62% of tracked traders finished profitable on closed positions, and the top ten spanned $1.36M to $10.27M.
The largest gains came from the fewest trades. Concentrated, multi-month conviction holds (pension-usdt.eth, Crystal Mole, Nitro Antelope) sat alongside high-frequency operators (Shadow Wallaby, Phantom Yak) and precision traders whose oversized winners covered low hit rates (RTB2).
For Mirrorly users, reading how each trader generates returns, and pairing complementary profiles, matters as much as the returns themselves.
Want to track and copy the best traders on Binance and Hyperliquid?
Join Mirrorly to access real-time insights from top leaderboard accounts and follow their moves with precision.
👉 Join Here
Check out the blog for more insights: https://blog.mirrorly.xyz/
We track a carefully curated and regularly updated list of top-performing public traders across platforms like Binance and Hyperliquid. While we aim for high data accuracy, some limitations remain, such as traders switching to private mode or technical constraints like rate limits. Despite these challenges, we dedicate significant effort to ensure the data is as reliable as possible.