Top Traders Report - April '26#
Introduction#
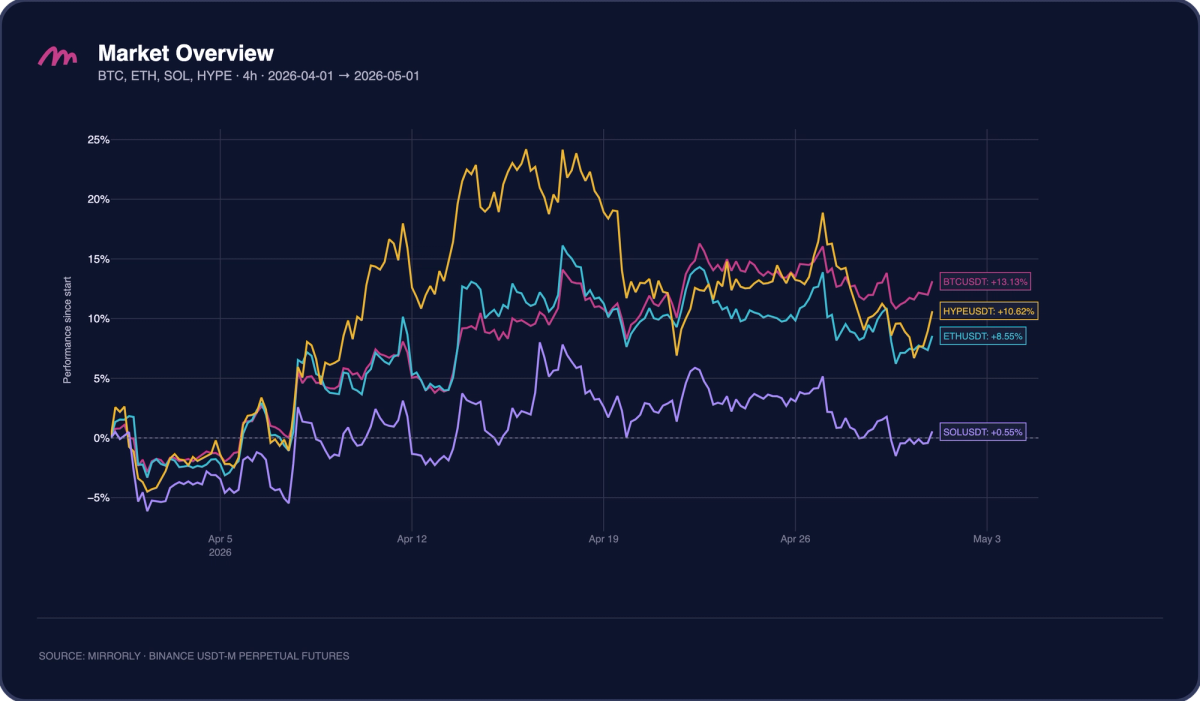
April was a broadly positive month for the major crypto assets in this report, although performance was uneven across names. $BTC finished strongest at roughly +13.1%, followed by $HYPE at about +10.6% and $ETH at about +8.6%. $SOL was the clear laggard, ending close to flat at roughly +0.6%. The month was not a straight line: $HYPE led during the middle of April, at one point trading above +20%, while $BTC and $ETH gained more steadily into the final week.
This month Mirrorly’s top 3 traders are:#
🏆 Shadow Wallaby (Hyperliquid): +$4M
🥈 cat hot wallet (CL) (Hyperliquid): +$502k
🥉 Alpha Pelican (Hyperliquid): +$276k
Shadow Wallaby led April with roughly $4.0M in profit across only 11 closed positions, while executing 1,715 trades inside those positions. His win rate was extremely high at 90.9%, and the average win was $441K versus an average loss of $410K. The average loss was still large in dollar terms, but with only one losing position and a profit factor of 10.76, his month was dominated by a small set of large winners. His winners were held for about 6 days and 19 hours on average, while the losing side was held much longer at roughly 19 days and 5 hours.
cat hot wallet (CL) finished second with $502.5K in profit across 18 closed positions and 300 trades. Unlike Shadow Wallaby, this trader had a low win rate at 38.9%, but the payoff profile compensated for it: the average win was $124.5K versus an average loss of $33.5K, a ratio of roughly 3.7x. Winners were held for almost 11 days on average, while losers lasted less than 2 days, showing a clear tendency to let profitable positions develop while cutting losing trades faster.
Alpha Pelican generated $275.6K across 32 closed positions and 153 trades. The win rate was moderate at 46.9%, but the average win of $20.4K was more than 11 times larger than the average loss of $1.7K. This explains the high profit factor of 10.29 and the strongest average profit-to-drawdown ratio of the group at 13.97. Holding periods were short on both sides, around 3.5 hours for winners and losers, pointing to a faster trading style with tightly contained downside.

Trader Spotlight: Shadow Wallaby#
Notional Exposure and PnL#
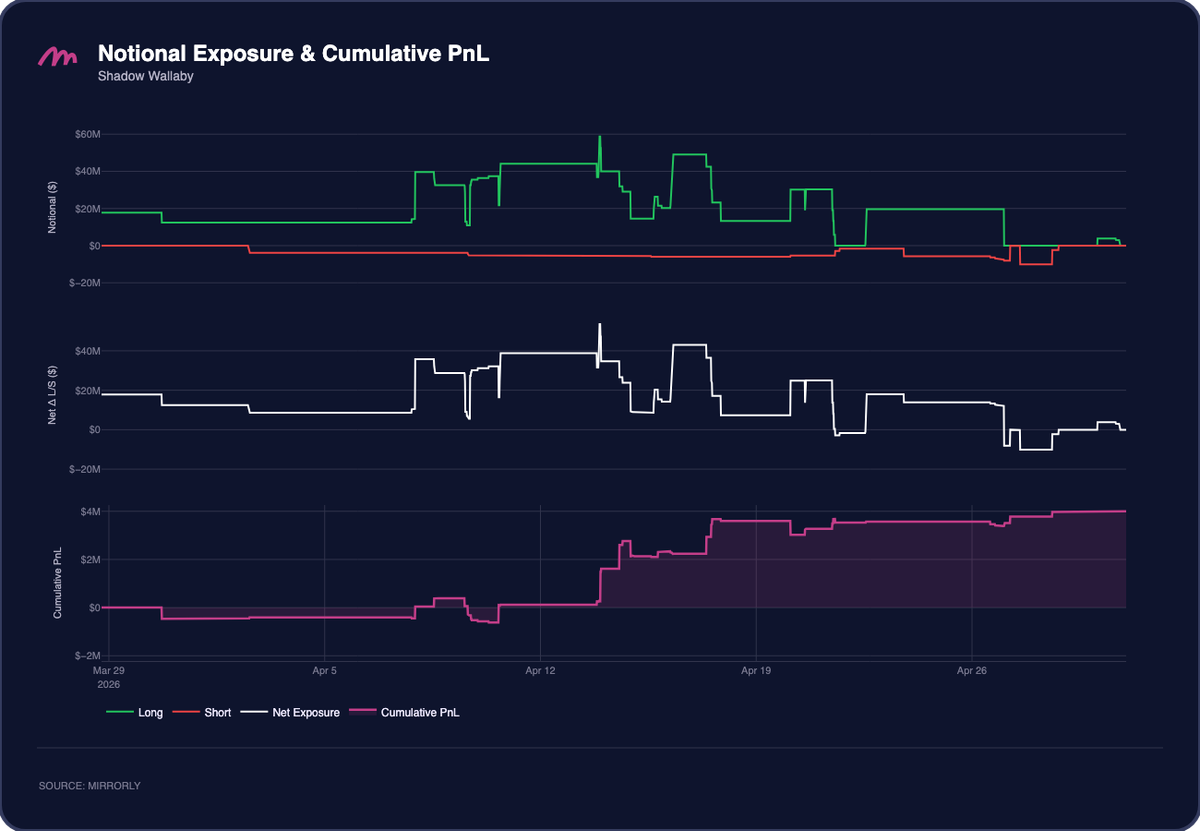
Shadow Wallaby ran the largest book of the three and was primarily long during the month. Long notional frequently sat between roughly +$15M and +$45M, briefly reaching close to +$60M around mid April, while short exposure was much smaller for most of the period. Net exposure stayed strongly positive through the first two thirds of the month, peaking near +$50M, before briefly moving slightly short in the final week. His PnL was flat to slightly negative early in April, then rose sharply around April 14 and continued toward roughly $3.8M by April 17. After a short consolidation, he finished the month near $4.0M.
Positions PnL by Symbol#
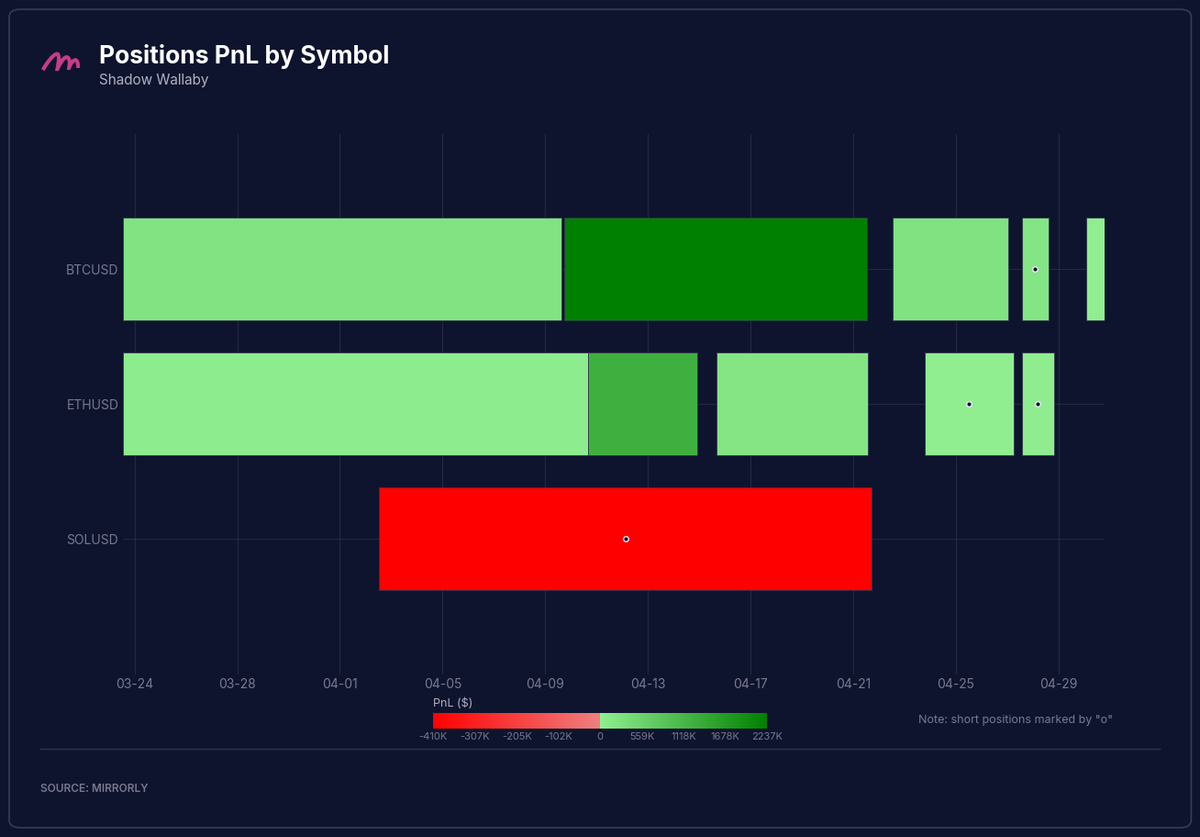
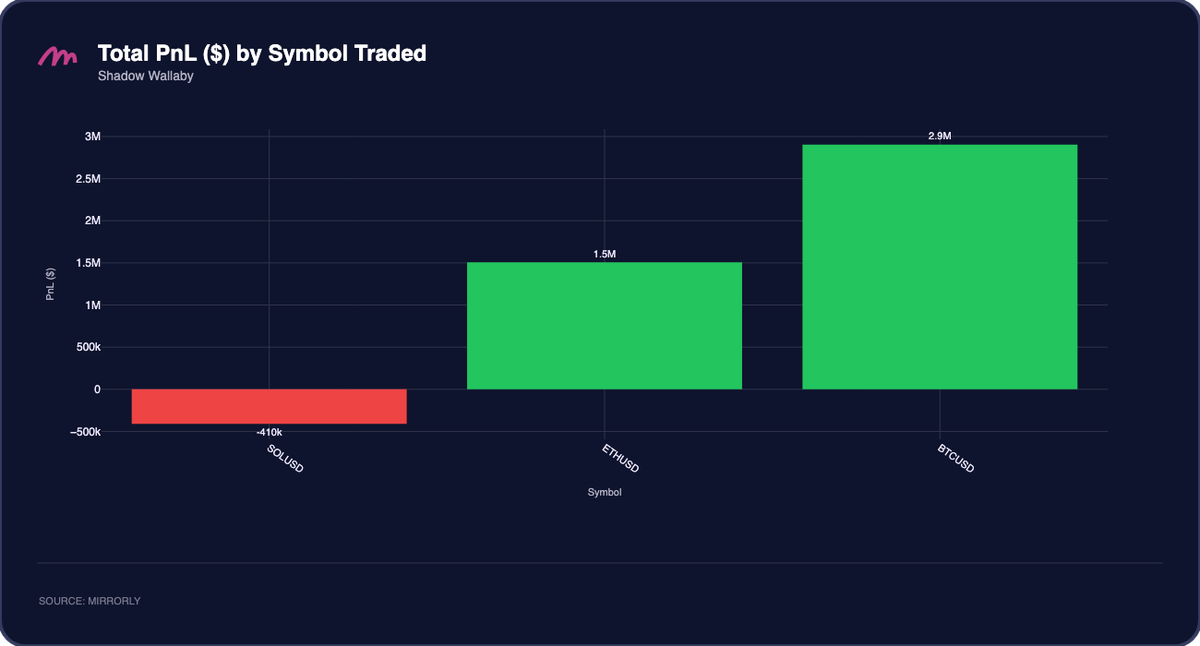
Shadow Wallaby traded only three symbols: $BTC, $ETH, and $SOL. The book was concentrated in long $BTC and $ETH winners, while the main losing exposure came from one $SOL short position.
Total PnL by Symbol#
Shadow Wallaby’s profits were almost entirely explained by two majors. $BTC contributed approximately +$2.9M and $ETH added about +$1.5M, while $SOL was the only losing symbol at roughly -$410K.
PnL Distribution#
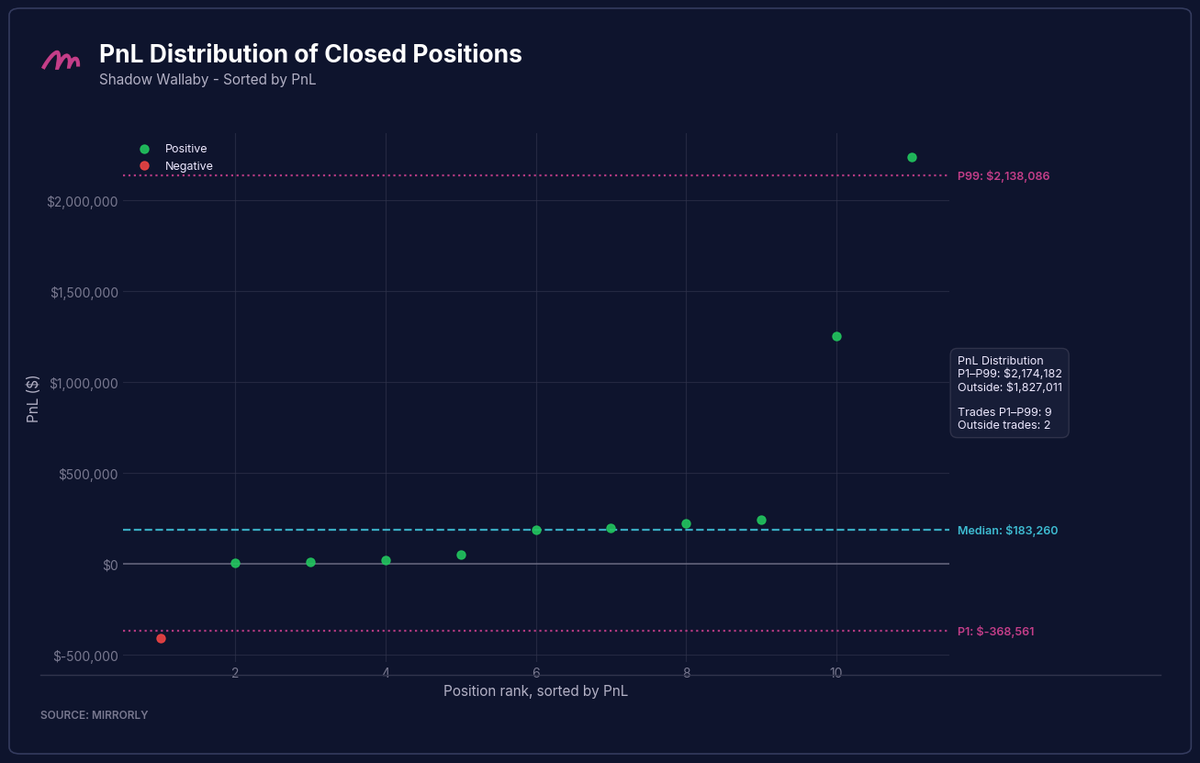
Shadow Wallaby’s closed position distribution was strongly positive. The median position was approximately +$183K, and the 99th percentile reached about +$2.20M versus a 1st percentile of roughly -$369K. The 9 positions inside the P1 to P99 range generated about $2.17M, while the 2 tail positions added another $1.83M in aggregate. This shows that the month was not only one trade, but the largest upper tail winner still contributed a large share of the final result.
Trader Spotlight: cat hot wallet (CL)#
Notional Exposure and PnL#
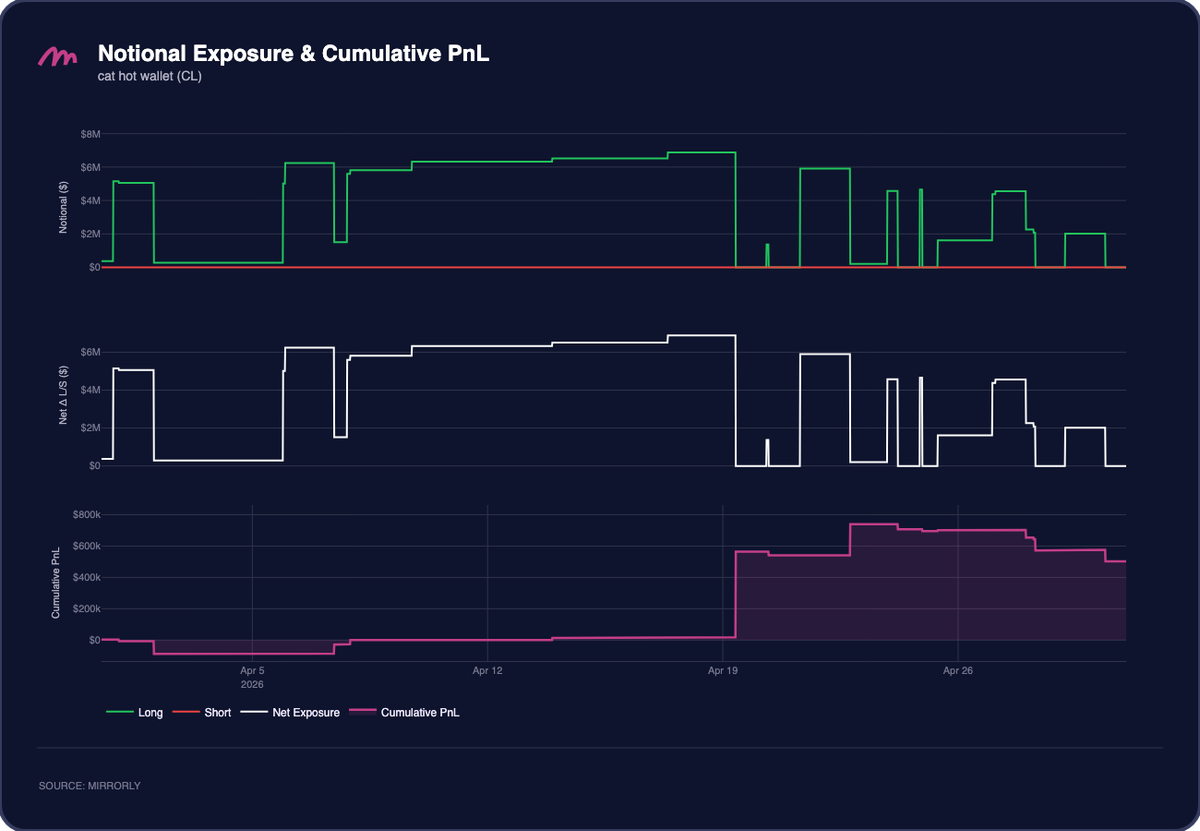
cat hot wallet (CL) followed a clean long only profile. Long notional was usually deployed in discrete blocks between roughly +$4M and +$7M, including a sustained position through the middle of April and several shorter entries in the final third of the month. PnL was slightly negative in the first week, then stayed close to flat until a major increase around April 19 took cumulative profit above $500K. The curve peaked near $730K around April 22 before giving back part of the gain and finishing around $502K.
Positions PnL by Symbol#
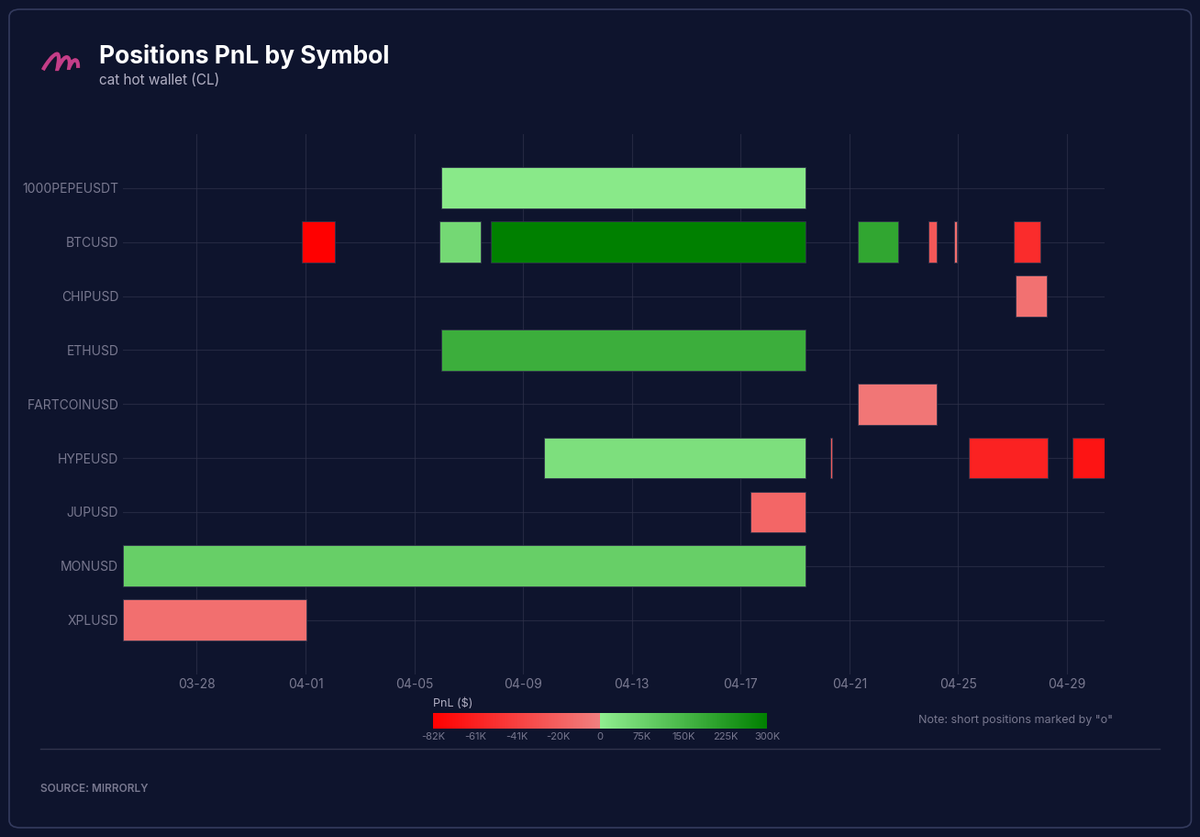
cat hot wallet (CL) traded a broader set of nine symbols, with activity across $BTC, $ETH, $HYPE, $MON, $1000PEPE, $FARTCOIN, $JUP, $CHIP, and $XPL. The largest profitable activity came from long $BTC, $ETH, and $MON.
Total PnL by Symbol#
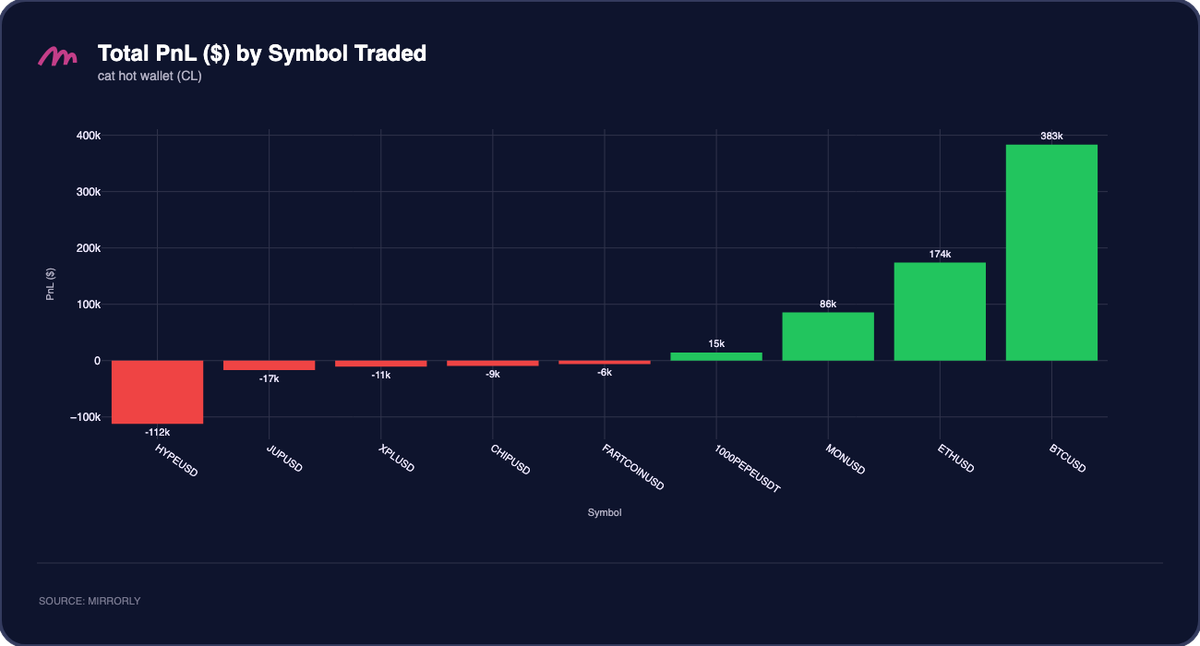
The total PnL by symbol shows a concentrated positive book with several small offsets. $BTC was the main contributor at about +$383K, followed by $ETH at +$174K and $MON at +$86K. Smaller positive PnL came from $1000PEPE, while the largest losses were $HYPE at roughly -$112K, $JUP at -$17K, $XPL at -$11K, $CHIP at -$9K, and $FARTCOIN at -$6K.
PnL Distribution#
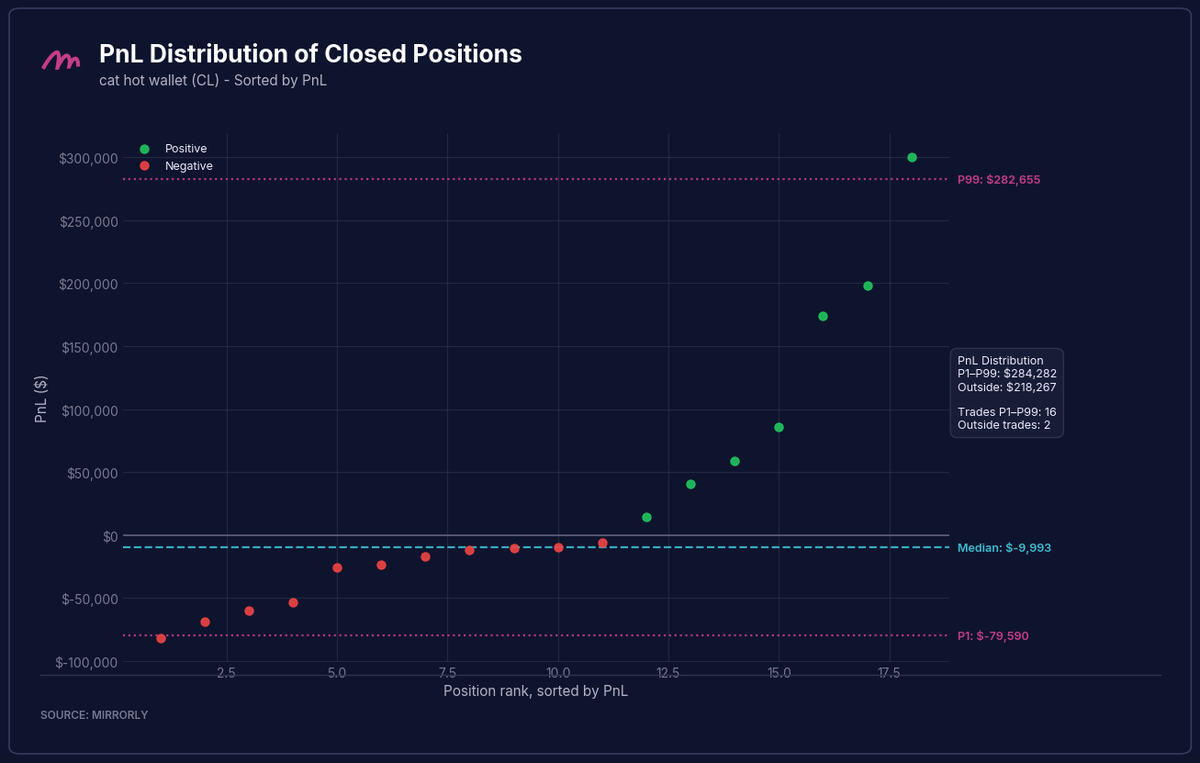
cat hot wallet (CL)’s distribution explains how a trader can rank second with a win rate below 40%. The median closed position was negative at about -$10K and the 1st percentile was around -$79.6K, but the upper tail was much larger, with the 99th percentile at approximately +$282.7K. The 16 trades inside the P1 to P99 range produced about $284K, while the 2 tail trades added another $218K. The month relied on a relatively small number of large winners overcoming a larger count of smaller losses.
Trader Spotlight: Alpha Pelican#
Notional Exposure and PnL#
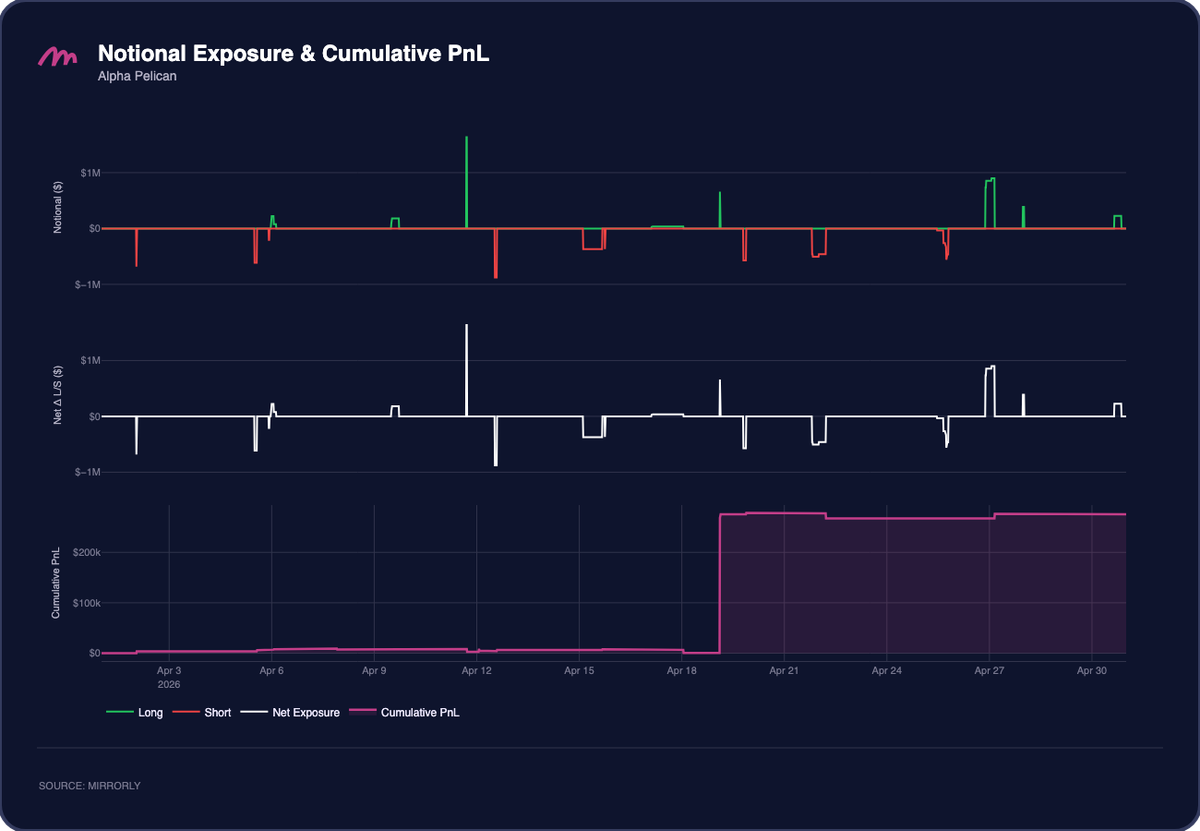
Alpha Pelican used much smaller exposure than the other two traders and kept net exposure close to flat for most of April, with brief bursts in both directions. Long notional occasionally reached above +$1M, while short exposure briefly approached -$900K, but most of the month was made up of short holding periods and limited directional exposure. The PnL curve stayed near breakeven through the first half of April, then moved sharply higher around April 18 and remained close to +$275K for the rest of the month.
Positions PnL by Symbol#
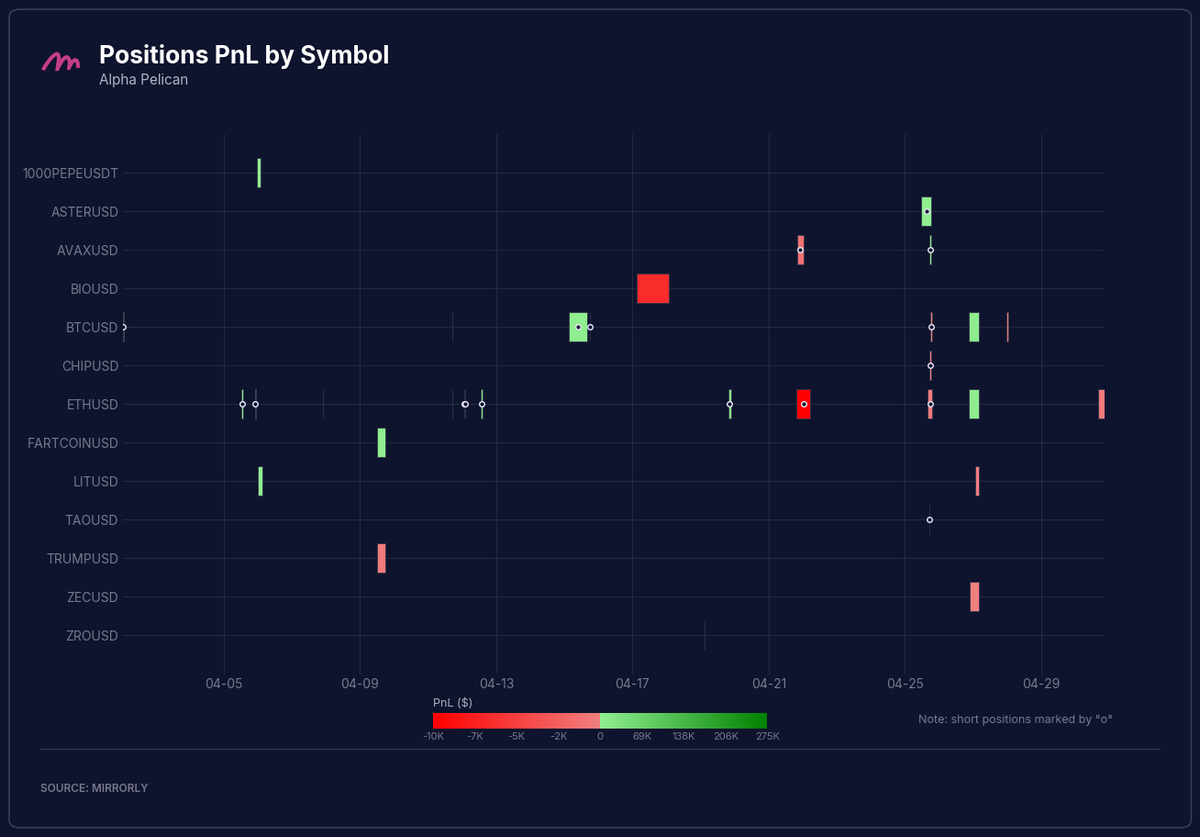
He traded the broadest symbol set of the three, with activity across 13 symbols. Most individual positions were small, and the chart shows many short duration trades clustered around breakeven.
Total PnL by Symbol#
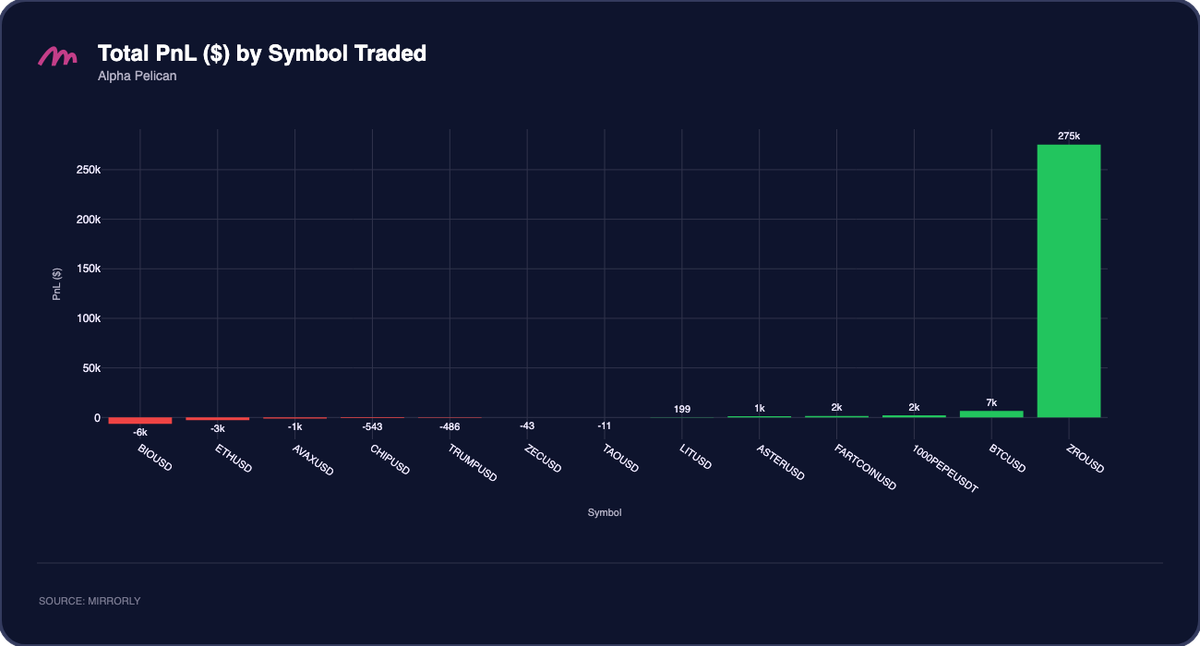
Alpha Pelican’s month was almost entirely driven by $ZRO, which contributed about +$275K. The rest of the book was close to flat in aggregate, with small positive results from $BTC (+$7K), $1000PEPE (+$2K), $FARTCOIN (+$2K), and $ASTER (+$1K), offset by small losses in $BIO (-$6K), $ETH (-$3K), $AVAX (-$1K), $CHIP (-$543), $TRUMP (-$486), $ZEC (-$43), and $TAO (-$11). This was basically a one symbol profit month with strict loss control elsewhere.
PnL Distribution#
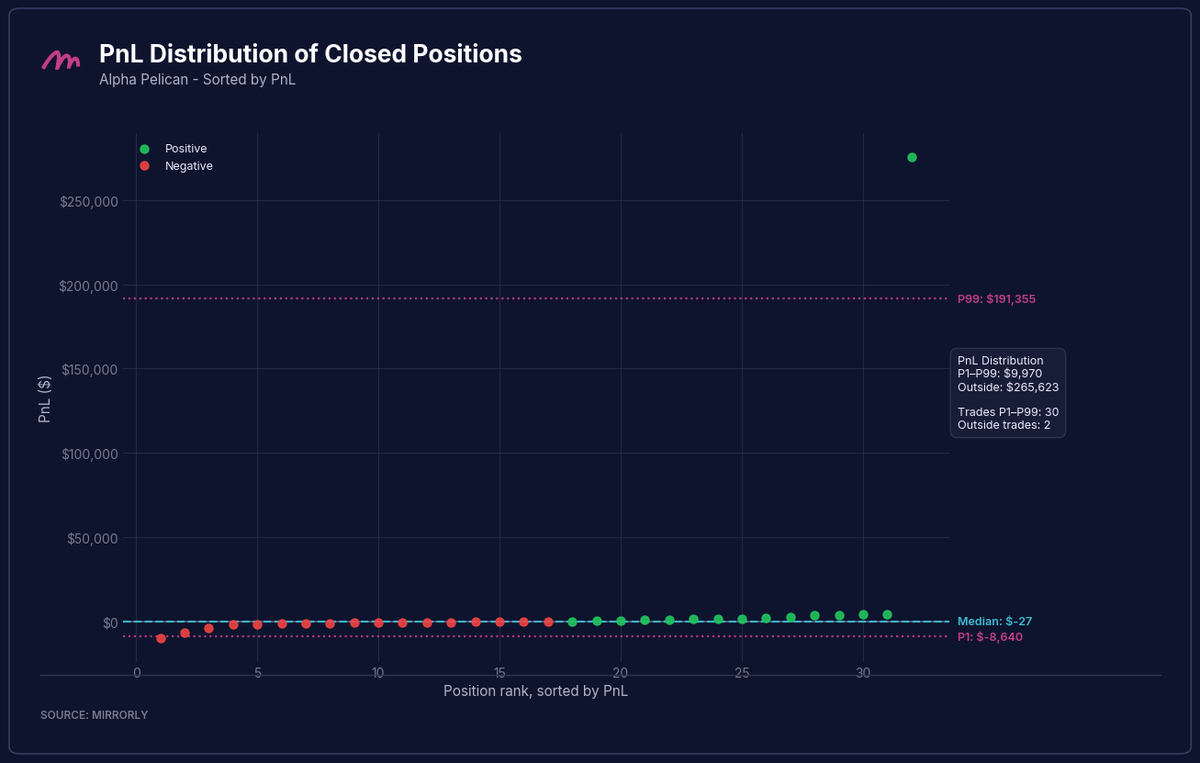
As expected, Alpha Pelican’s distribution was tightly clustered around breakeven except for one large winning outlier. The median closed position was essentially flat at -$27, and the 1st percentile was only -$8.6K, showing that downside was tightly contained. The 30 trades inside the P1 to P99 range generated just under $10K in total profit, while the 2 tail trades contributed about $265.6K.
Case Study - The Cat Did It Again#
cat hot wallet (CL) is the clearest example in this report of a trader who did not need a high win rate to finish near the top of the month. He closed 18 perp positions in April and won on only 38.9% of them, but the payoff profile was strong enough to offset the low hit rate. His average winning position was about $124.5K, while his average losing position was about -$33.5K. In other words, the average winner was roughly 3.7 times larger than the average loser.
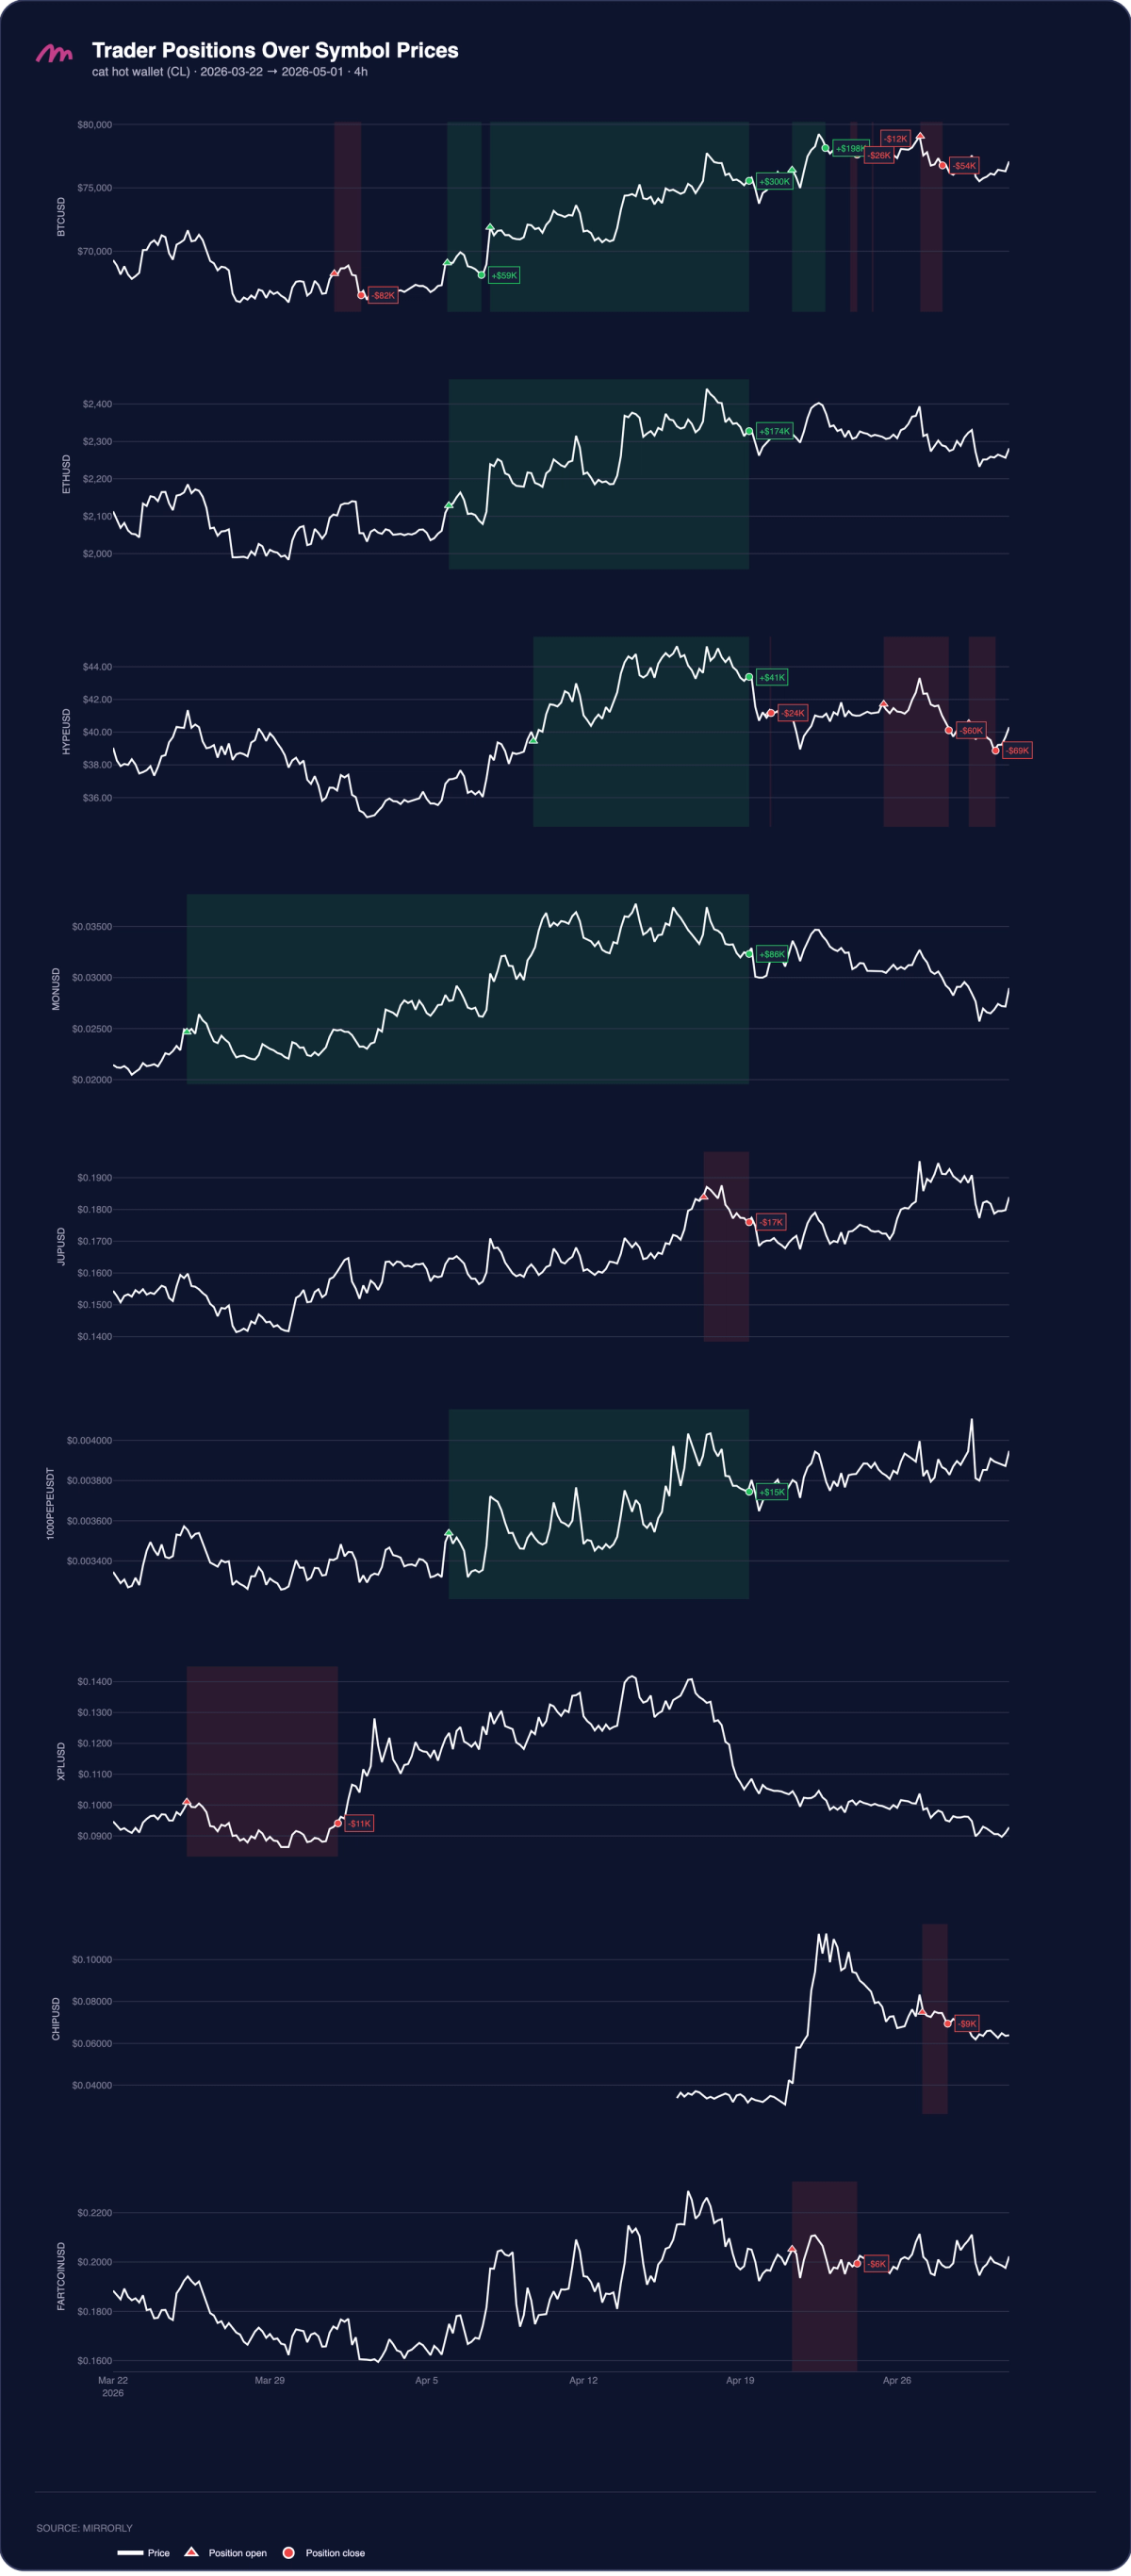
The full position overview shows the core pattern. CL did not make money across every symbol. His losses came from $HYPE, $JUP, $XPL, $CHIP, and $FARTCOIN, while the month was paid for by a small set of larger winners in $BTC, $ETH, and $MON. That is why the PnL distribution had a negative median position around -$10K but still produced a strong monthly result.
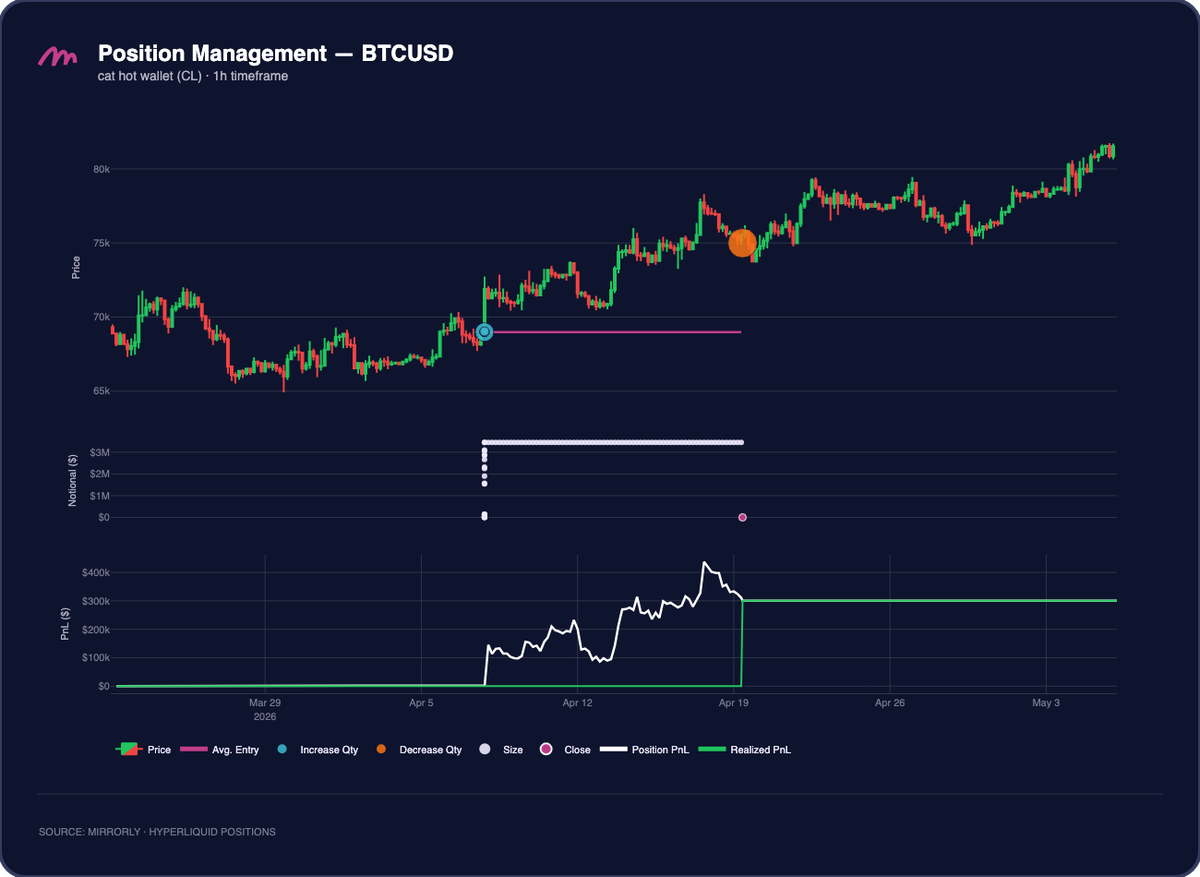
His largest contribution came from $BTC. In the first BTC winner, CL built a long around the $69K area in early April, held a notional position of roughly $3M through the move higher, and closed around April 19 near $75K. The unrealized PnL reached above $400K before he closed the position, and realized PnL ended around +$300K.
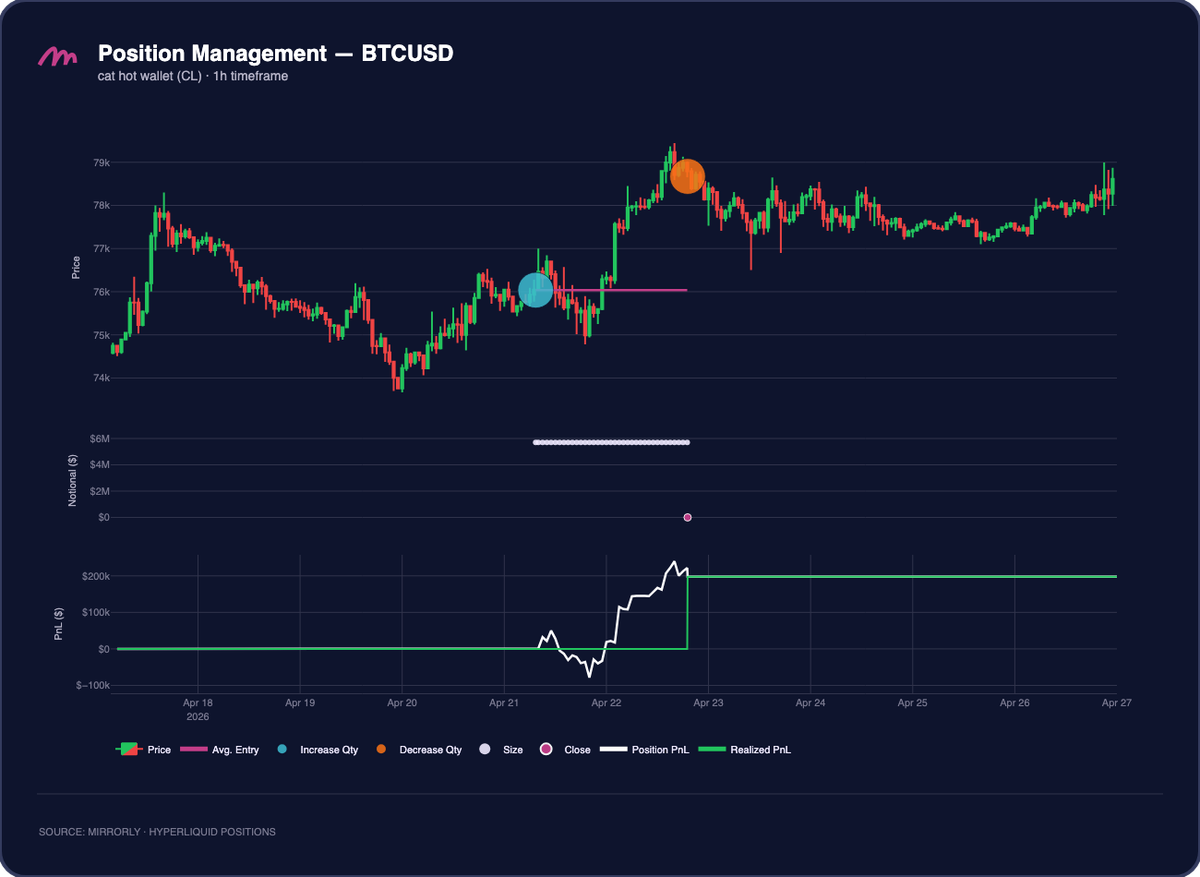
The second BTC trade shows the same playbook on a shorter window. CL entered near $76K around April 21, sat through a temporary drawdown as price dipped below his entry, and then held into the breakout toward $79K. He closed the position around April 22 for roughly +$198K. This is important because the trade was not immediately clean. He tolerated some initial heat, but the position only became a large winner because he stayed in while the move developed.
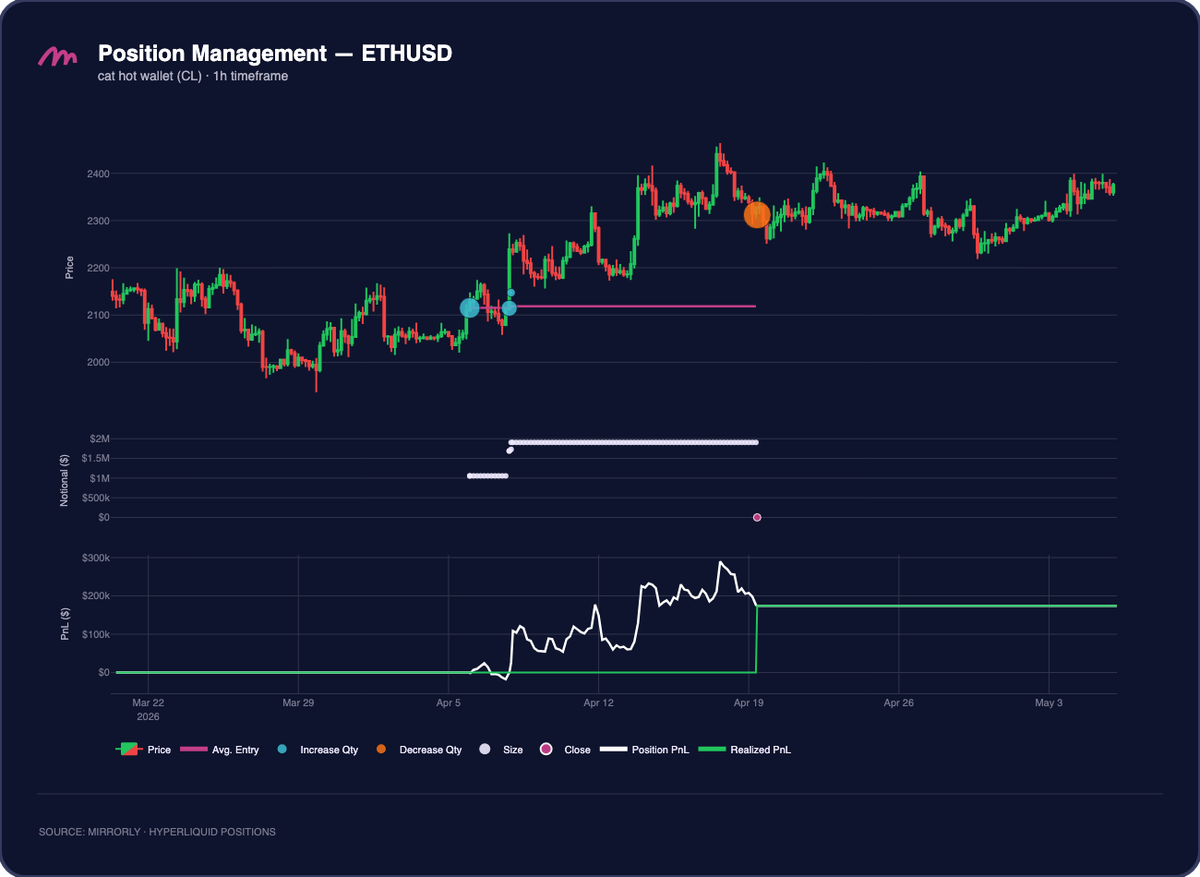
The $ETH trade followed a similar structure. CL scaled into ETH around the $2.1K area, increased notional from about $1M to nearly $2M, and held through the mid-April move above $2.3K. He closed around April 19 for roughly +$174K. Together, the two BTC trades and the ETH trade explain most of his positive symbol-level PnL.
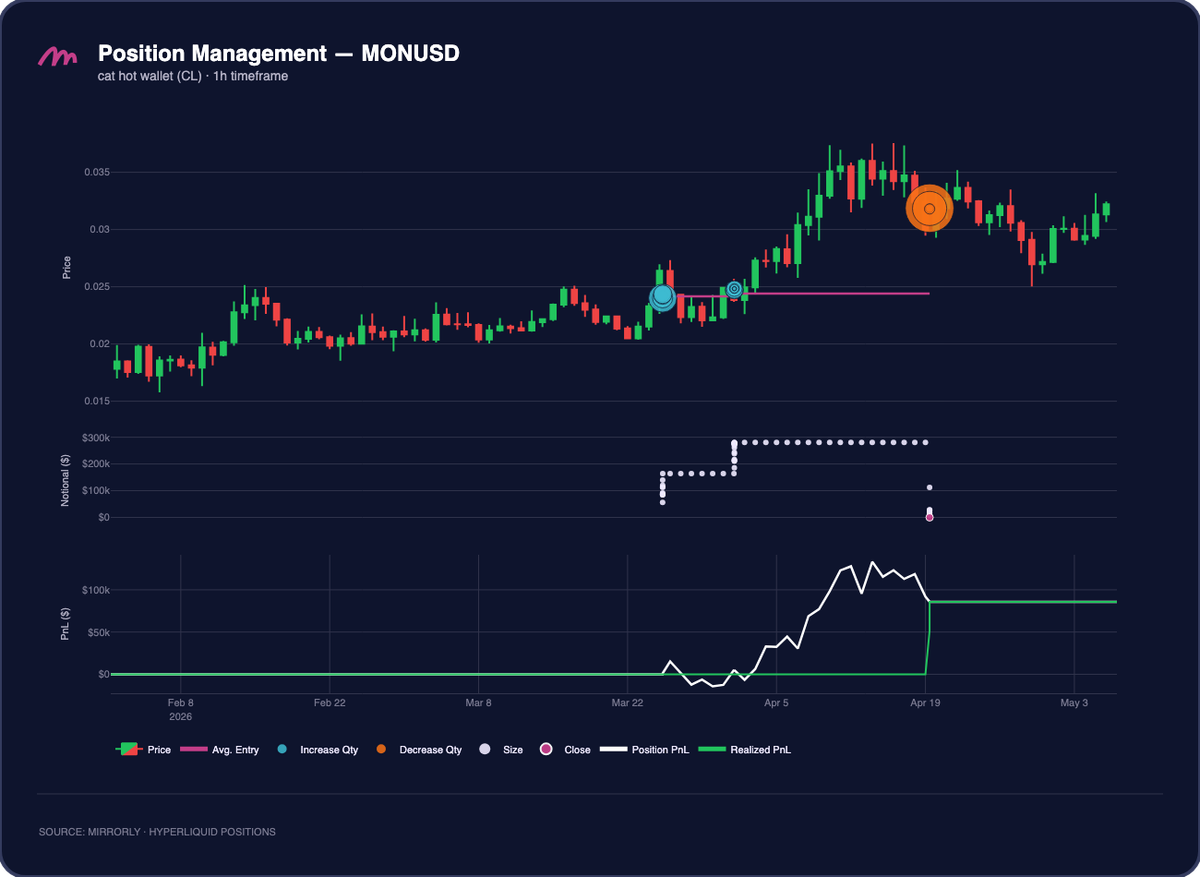
The $MON trade is smaller in absolute dollars but useful for understanding timing. CL began building the position around March 25 near the $0.024 to $0.025 area, close to the ICO-price level that the market was watching at the time. He scaled the position to roughly $280K notional, held through the move above $0.035, and closed around April 19 near $0.032 for about +$86K. This was not his biggest winner, but it shows the same behavior: enter near a base, hold through the expansion, and close after the move has already paid.
CL held winning positions for almost 11 days on average, while losing positions lasted less than 2 days. The PnL distribution confirms the same asymmetry: the 99th percentile reached about +$282.7K, compared with a 1st percentile near -$79.6K. The 16 positions inside the P1 to P99 range generated about $284K, and the 2 tail positions added another $218K.
Conclusion#
April’s top traders show three different ways to extract value from the same market: Shadow Wallaby dominated through concentrated $BTC and $ETH exposure, cat hot wallet (CL) won through payoff asymmetry despite a low hit rate, and Alpha Pelican turned one large $ZRO winner into most of his monthly PnL. For copy traders, the key lesson is to look past headline profit and study how each trader gets there: position concentration, loss control, holding time, and whether the edge depends on many small wins or a few large ones.
Follow our highlight traders on Twitter:#
Shadow Wallaby: please if you know, let us know his twitter handle
cat hot wallet (CL): https://x.com/CL207
Alpha Pelican: please if you know, let us know his twitter handle
Join Mirrorly: https://mirrorly.xyz/
Subscribe to our Notifications so you don't miss next month's report!