
Introduction#
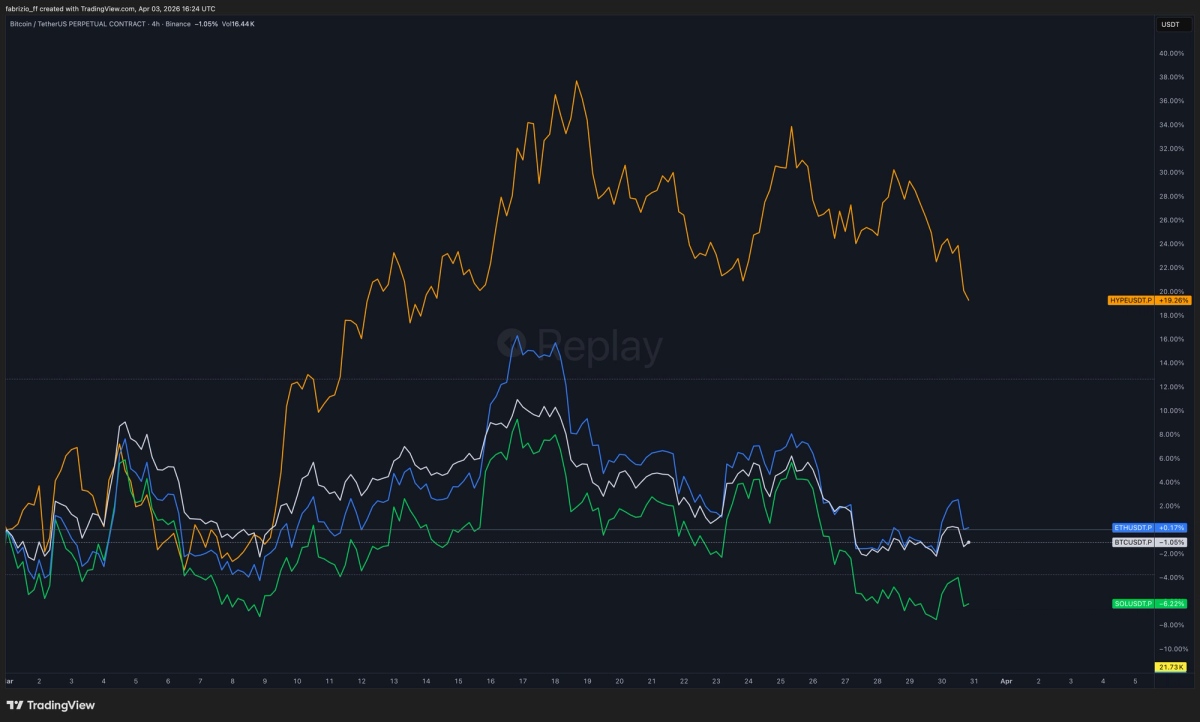
March was a mixed month for the major crypto assets, with performance diverging meaningfully across the market. $BTC spent most of the month oscillating around flat and ultimately closed negative, down roughly 1%. $ETH followed a similarly choppy path and managed to breakeven, up about 0.2%. $SOL was the weakest of the group, trending lower through the second half of the month and ending down roughly 6.2%. By contrast, $HYPE was the clear relative-strength outlier. It rallied sharply through the middle of the month, at one point reaching gains well above 30%, and still finished March up about 19.3% despite a late pullback.
This month Mirrorly’s top 3 traders are:
🏆 Shadow Wallaby (Hyperliquid): +$2.76M
🥈 Cosmic Venom (Hyperliquid): +$1.41M
🥉 Cool Russell (Hyperliquid): +$586K
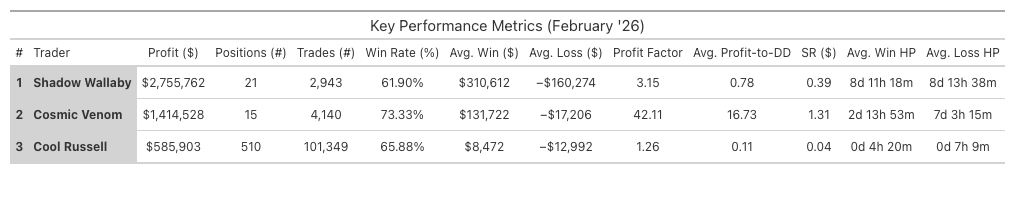
Shadow Wallaby led March with approximately $2.76M in realized profit across just 21 closed positions, combining a 61.9% win rate with the largest average win of the group at $310.6K. His average winner was roughly 1.9 times the size of his average loser ($160.3K), and his holding periods were long on both sides, just over 8 days for winners and losers alike, consistent with a swing trading style. With a profit factor of 3.15, he did not need a high trade count to dominate the month. Instead, the result came from a small number of large, well-paid positions.
Cosmic Venom finished second with about $1.41M in profit across 15 closed positions. He posted the highest win rate of the three at 73.3% and a very high profit factor of 42, driven by a strong asymmetry between average wins ($131.7K) and average losses ($17.2K). The average profit-to-drawdown ratio of 16.7 was also by far the highest in the group, indicating that realized gains were large relative to the heat taken while positions were open. Winners were held for about 2.5 days, while losers were held longer, just over 7 days, but the losing side remained so small in dollar terms that it barely dented the month’s result.
Cool Russell was again the most active trader by a wide margin, closing 510 positions and executing more than 101K trades. He generated $585.9K in realized profits with a 65.9% win rate, but unlike the other two, his average loss ($13.0K) exceeded his average win ($8.5K). That imbalance helps explain the lower profit factor of 1.26. His edge came from volume and hit rate rather than payoff asymmetry. Holding periods were also the shortest of the group, averaging ~4 hours for winners and ~7 hours for losers.
Trader Spotlight: Shadow Wallaby#
Notional Exposure and PnL#
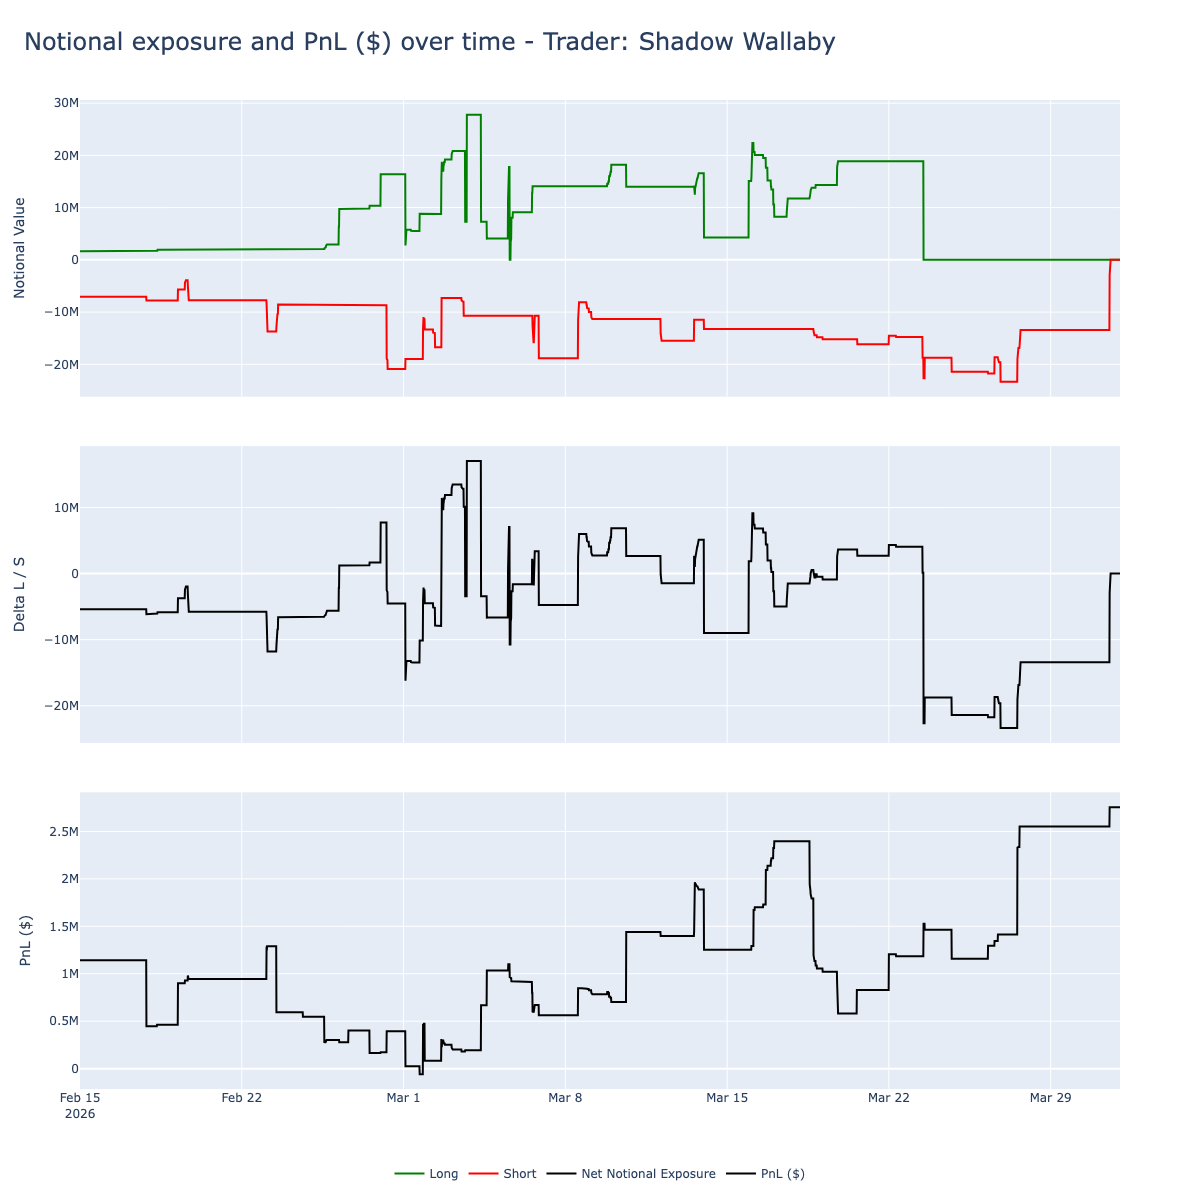
Shadow Wallaby ran the largest and most directional book of the three. Through most of March he carried simultaneous long and short exposure, with longs generally between +$5M and +$28M and shorts between roughly -$8M and -$23M. Net exposure swung sharply between long and short, reaching about +$15M in early March and roughly -$23M in the final week. His PnL started to near flat around March 1, then increased quickly to about $2.4M by mid-month, retraced to roughly $600K around March 20, and finished with a strong recovery to approximately $2.76M by month end.
Positions PnL by Symbol#
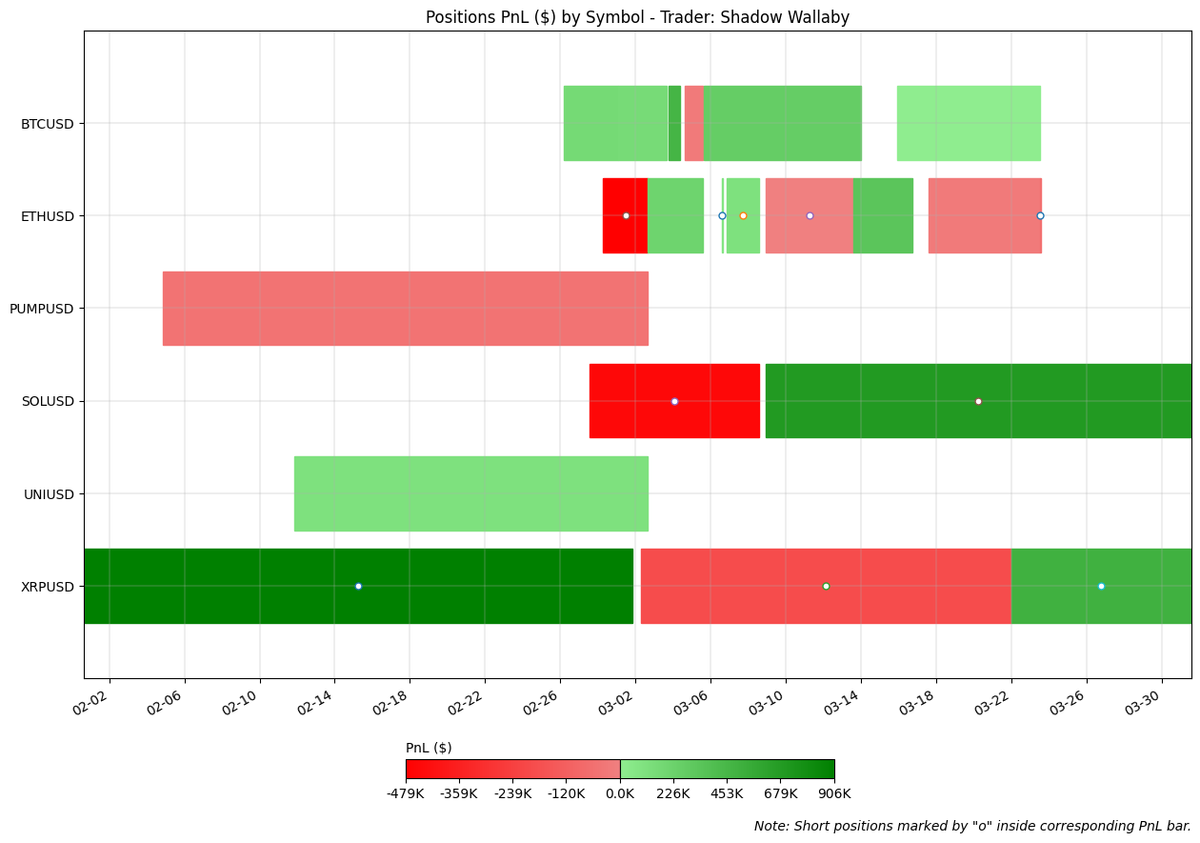
He traded a highly concentrated six-symbol universe: $BTC, $ETH, $SOL, $XRP, $UNI, and $PUMP. Most of the activity was in majors, especially $BTC, $XRP, $SOL, and $ETH, while $UNI appeared as a single long-duration winner and $PUMP as one extended losing trade.
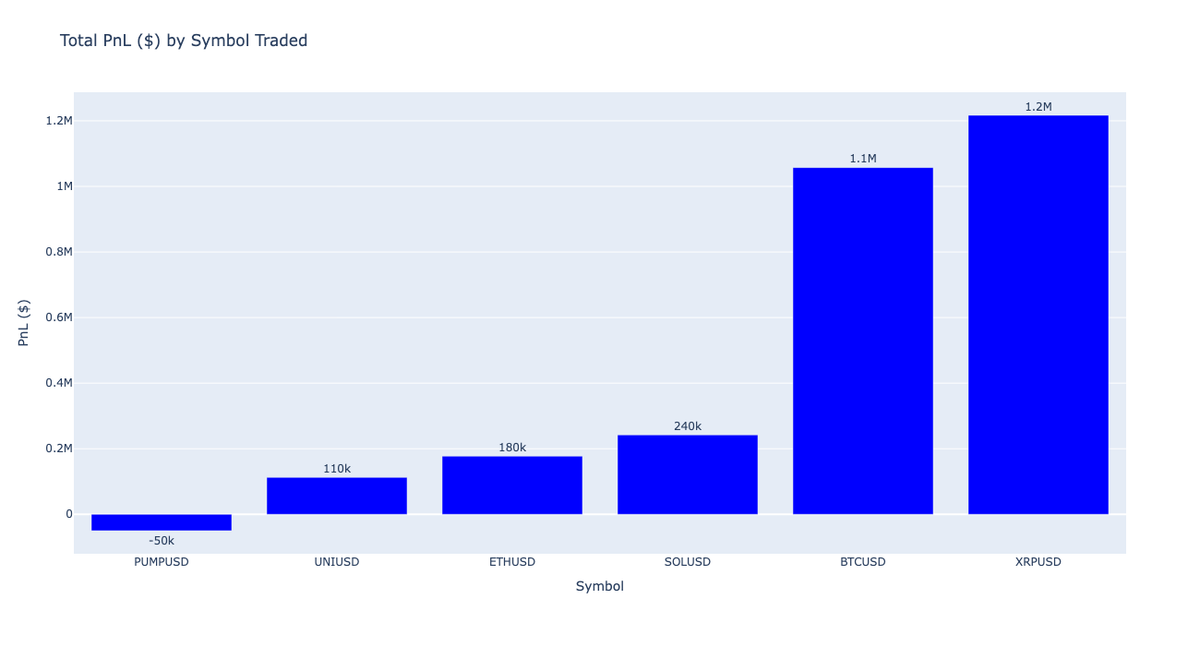
Total PnL by Symbol#
His gains were dominated by $XRP (+$1.2M) and $BTC (+$1.1M), with $SOL (+$240K) as the third-largest contributor. Those three symbols alone generated about $2.54M, roughly 92% of his total monthly PnL. $PUMP was the only losing symbol at about -$50K. This was a highly concentrated book with very little drag outside one losing trade.
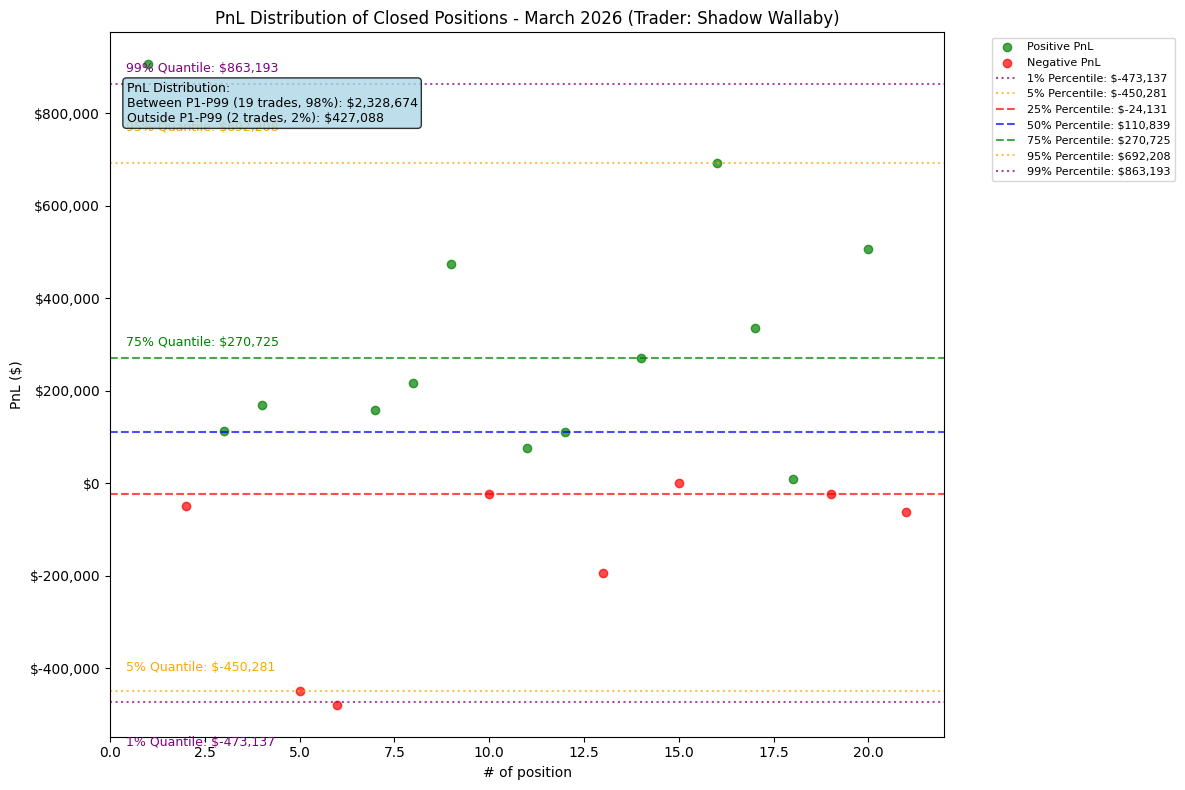
PnL Distribution#
Shadow Wallaby’s PnL distribution was strongly positive, even before considering the largest winners. The median closed position was about +$110.8K and shows that profitability was not limited to a handful of isolated trades. The 75th percentile reached +$270.7K versus -$24.1K at the 25th, an asymmetry of roughly 11x.
About $2.33M of profit came from the 19 positions within the P1 to P99 range, while the tails added another $427K, meaning the bulk of the month was generated by the core set of trades rather than by a single outlier.
Trader Spotlight: Cosmic Venom#
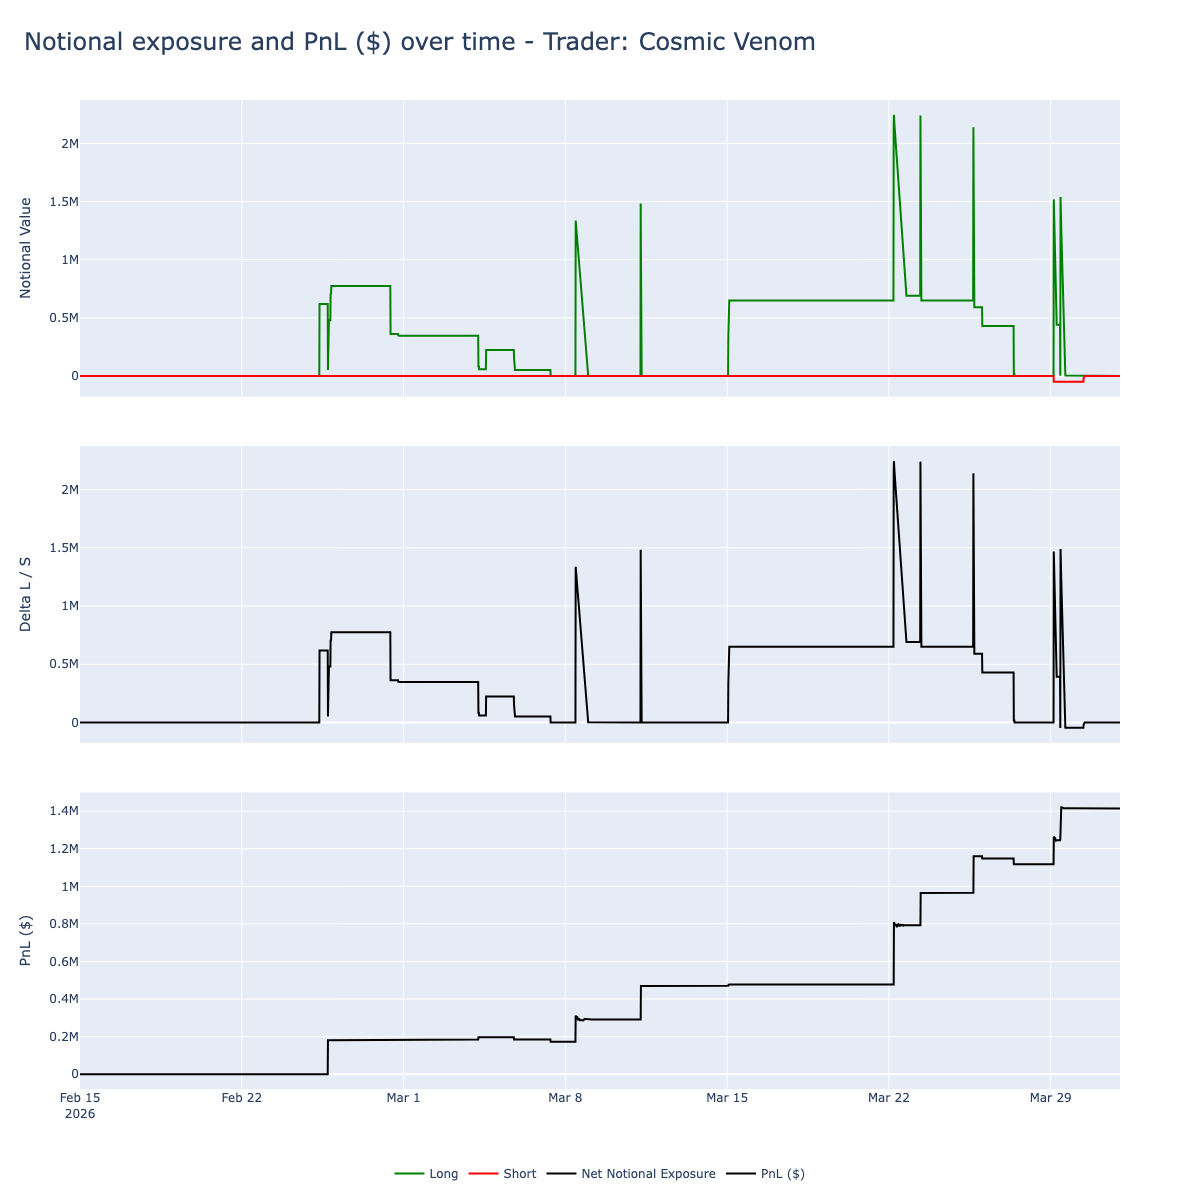
Notional Exposure and PnL#
Cosmic Venom followed the cleanest directional profile of the group. His book was almost entirely long, with no short exposure throughout the month. Most positions were often between roughly $300K and $800K notional, but he periodically increased exposure above $2M in the final third of the month. The PnL curve increased in a stepwise way from near zero at the start of March to approximately $1.41M by month end, with only minimal retracements.
Positions PnL by Symbol#
He traded ten symbols, concentrated in long trades across alt and narrative-driven names.
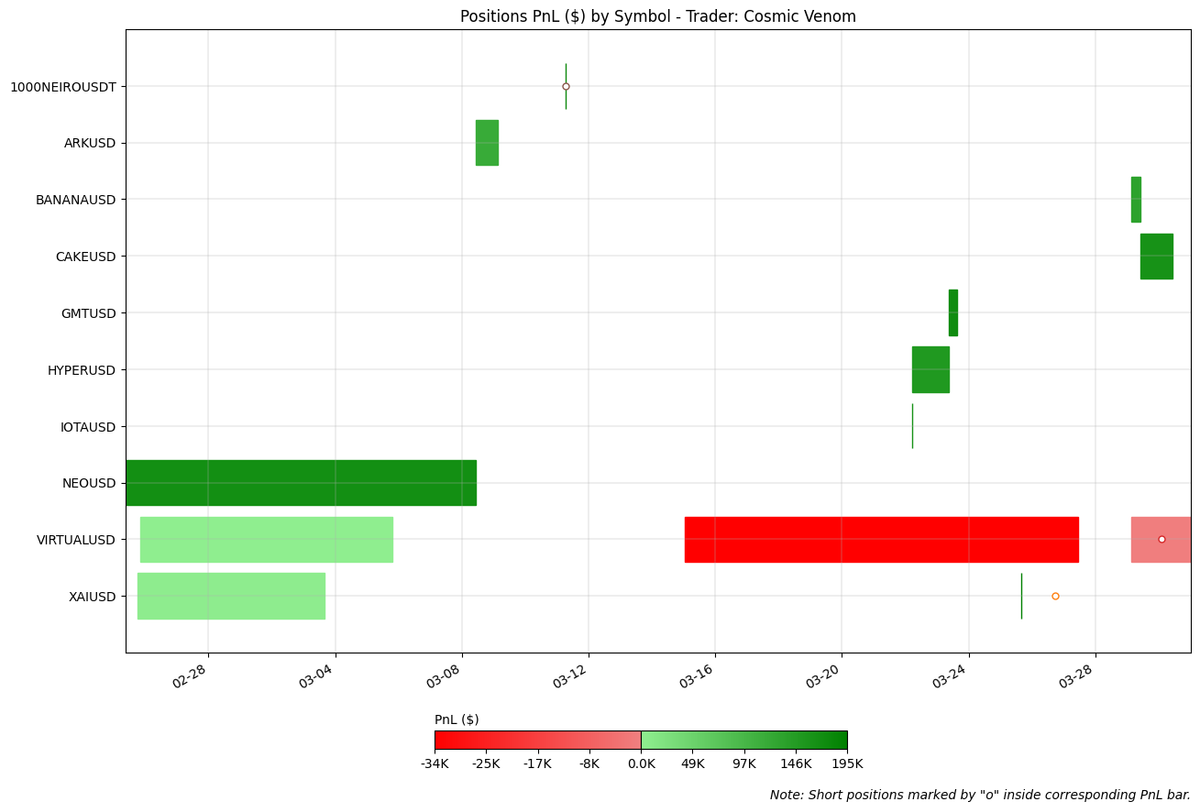
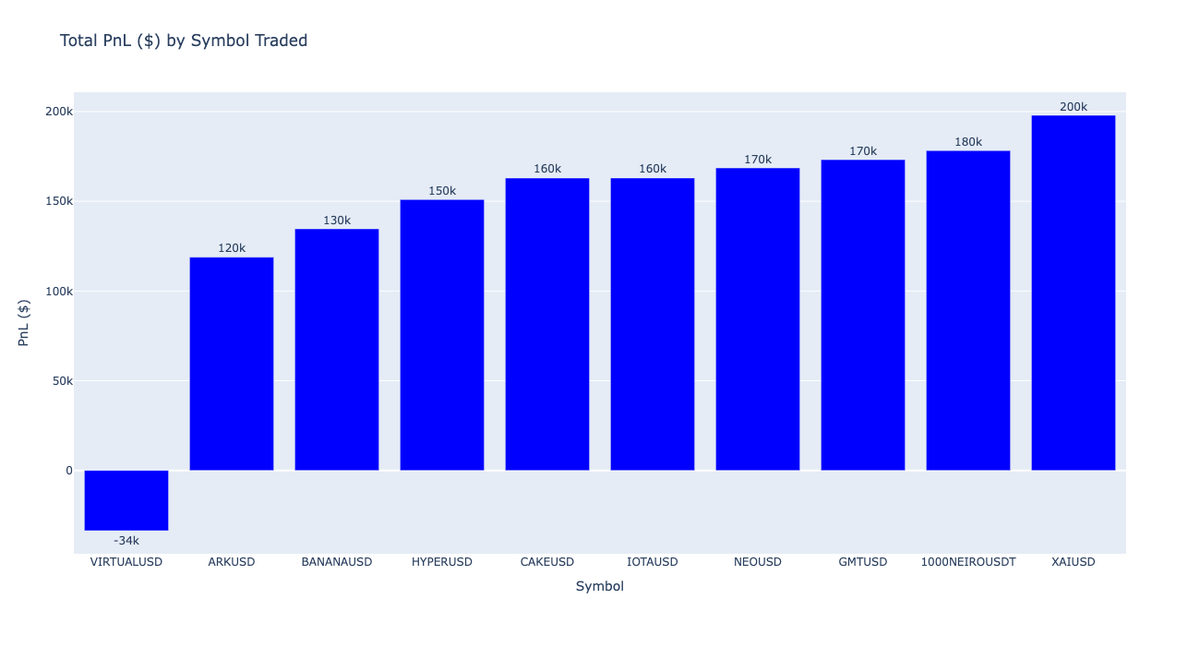
Total PnL by Symbol#
Unlike Shadow Wallaby, whose profits were concentrated in a few majors, Cosmic Venom’s gains were spread across almost the entire symbol set.
$XAI (+$200K), $1000NEIRO (+$180K), and either $GMT or $NEO (+$170K each) were the largest contributors, but the distribution stayed broad across $CAKE, $IOTA, $HYPER, $BANANA, and $ARK as well. The only negative symbol was $VIRTUAL at about -$34K.
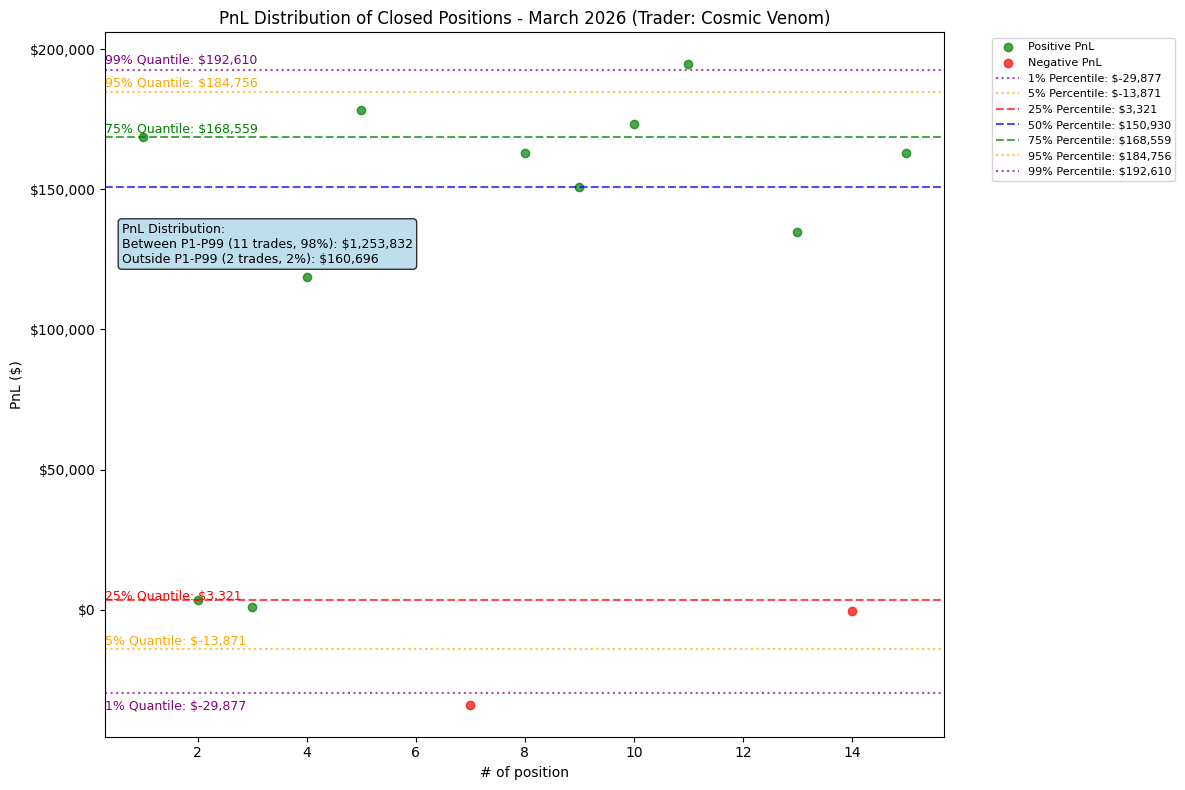
PnL Distribution#
Cosmic Venom’s closed-position distribution was one of the cleanest possible profiles for a profitable month, although we are looking to only 15 closed positions. The 25th percentile was already slightly positive at +$3.3K, which means losses were both infrequent and small. The median trade was approximately +$150.9K and the 75th percentile rose to +$168.6K. The core of the distribution accounted for about $1.25M in profits, with the tails adding another ~$161K.
Trader Spotlight: Cool Russell#
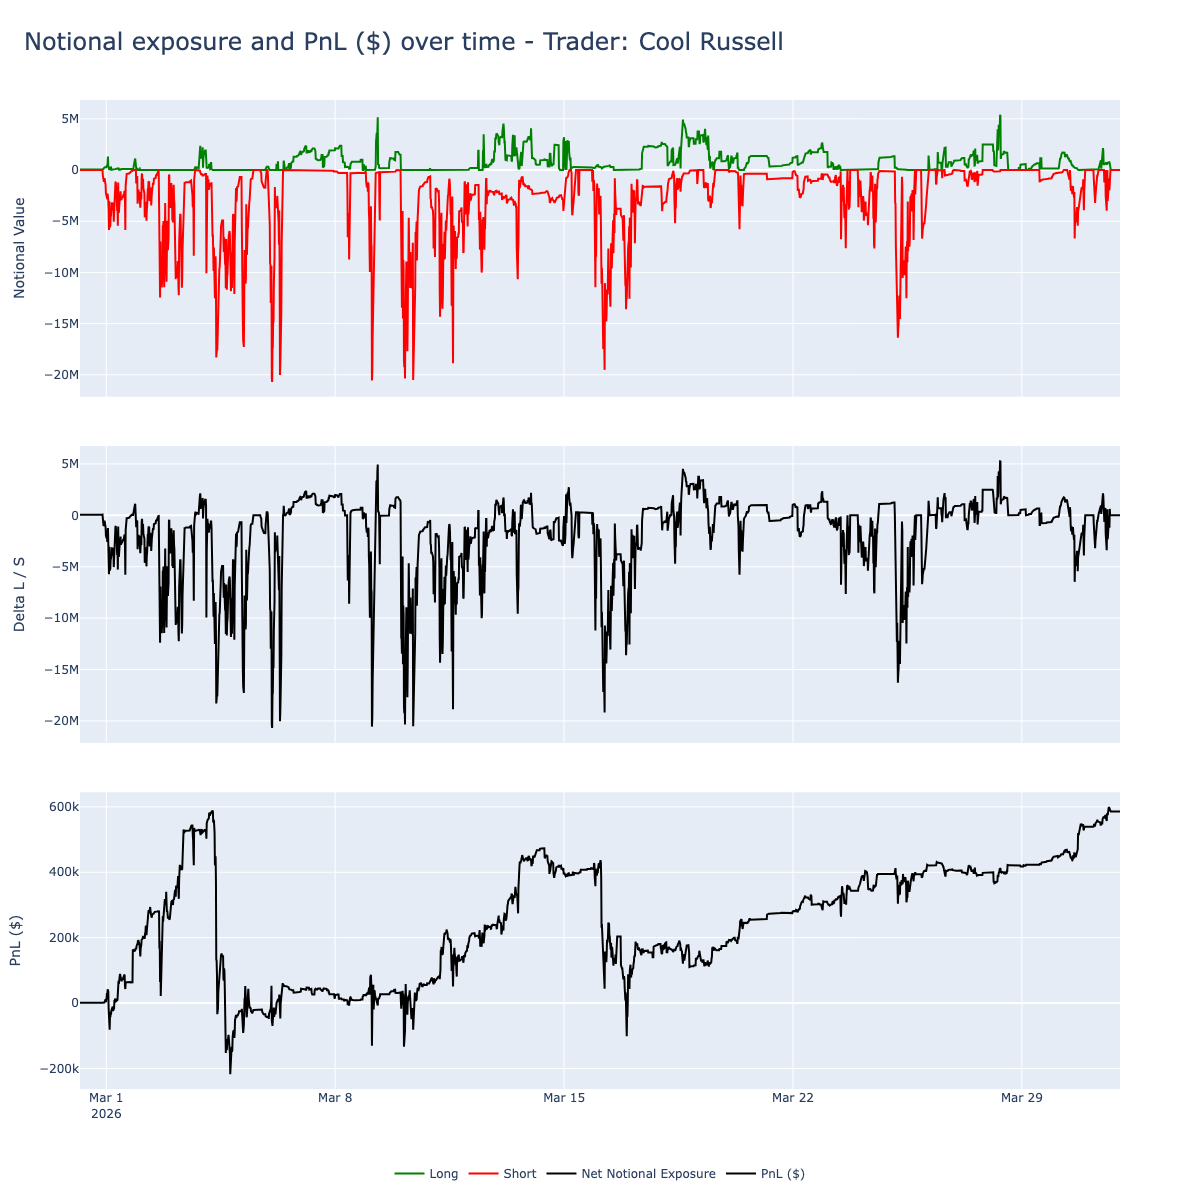
Notional Exposure and PnL#
Cool Russell remained the highest-frequency trader in for this month, and his exposure profile matched that style. He carried long and short positions simultaneously throughout March, but the net book was predominantly short for most of the month. Short exposure frequently sat between roughly -$2M and -$10M, with several deeper excursions approaching -$20M, while long exposure usually stayed below +$5M.
His PnL path was much more volatile than the other two traders. He ran up to roughly $550K in the first week, briefly dropped below zero, rebuilt to around $450K by mid-month, saw another sharp drawdown, and then recovered to finish near $586K.
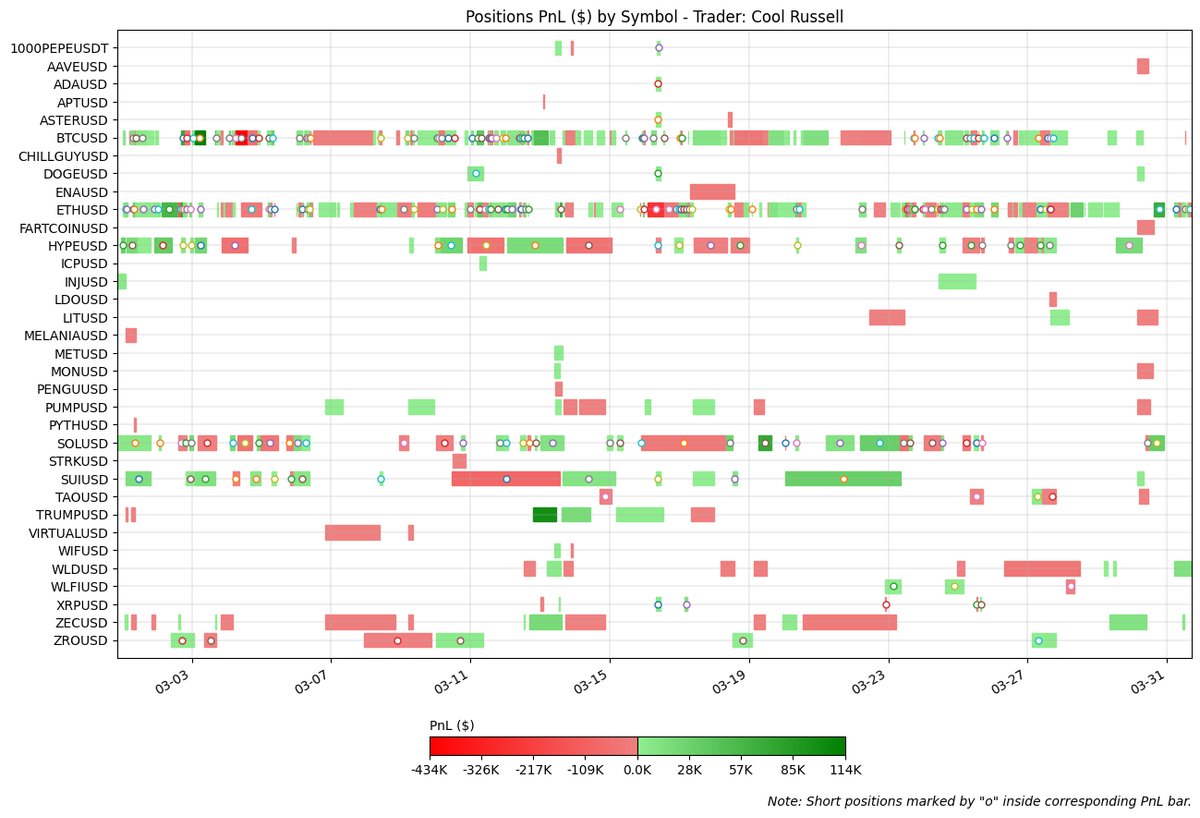
Positions PnL by Symbol#
He traded by far the broadest universe of the three, with activity spread across majors, perp DEX names, memecoins, and mid-cap alts.
$BTC, $ETH, $SOL, $SUI, and $HYPE were among the most persistent symbols traded, but the book also included names such as $TRUMP, $PUMP, $WLFI, $WLD, $ENA, $ZEC, $ZRO, and $ASTER. The wide symbol coverage reinforces that his process depends on very high turnover rather than concentrated conviction in a handful of names.
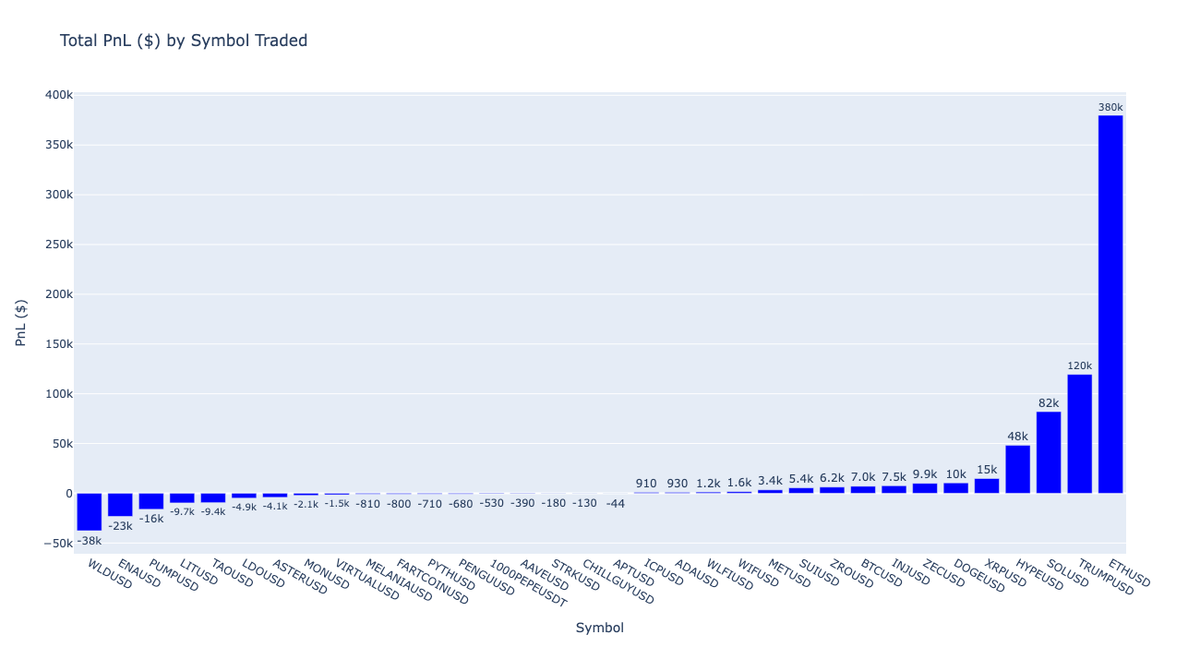
Total PnL by Symbol#
His PnL by symbol was far more concentrated than his trade count suggests. $ETH (+$380K), $TRUMP (+$120K), and $SOL (+$82K) contributed about $582K in total, nearly equal to his entire monthly realized profit. That implies the rest of the book was roughly flat after offsetting gains and losses. On the negative side, the largest drags were $WLD (-$38K), $ENA (-$23K), and $PUMP (-$16K), with a long tail of smaller losses across the rest of the universe.
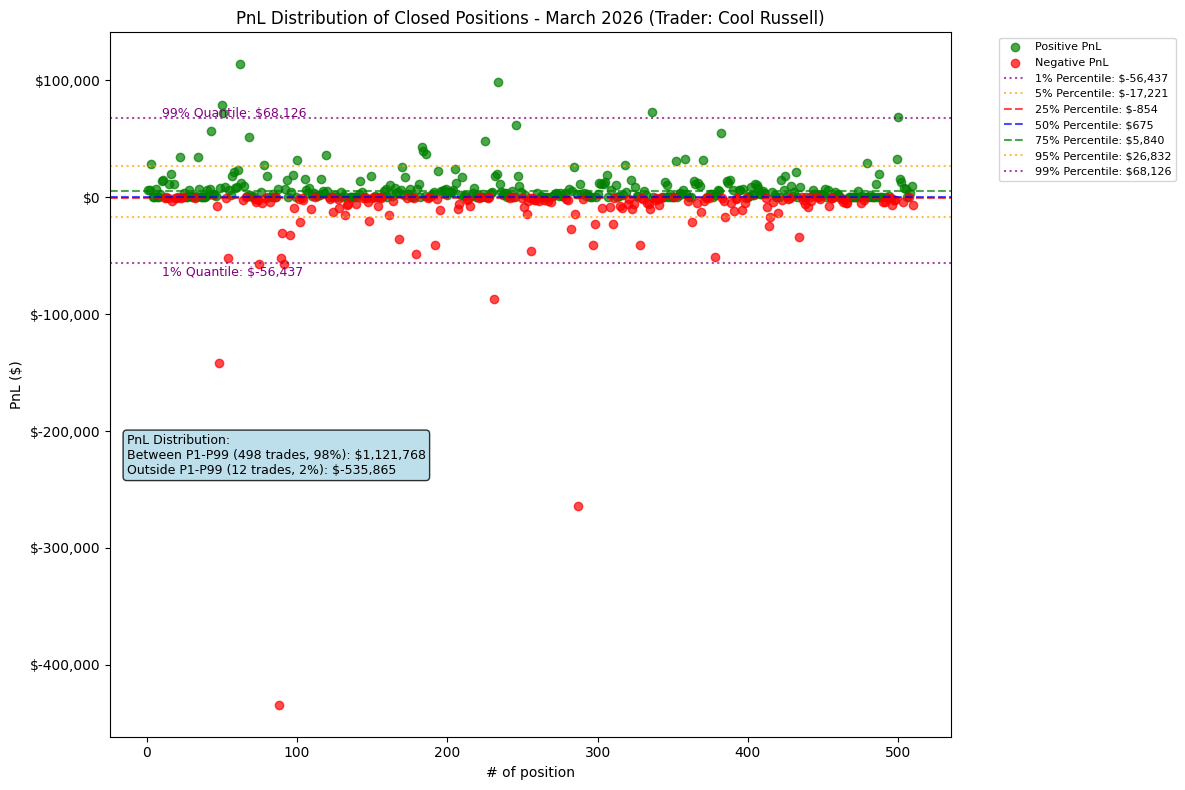
PnL Distribution#
Cool Russell’s PnL distribution explains the month well. The middle 50% of trades sat between -$854 and +$5.8K, with a median of +$675, indicating a small but persistent edge across a very large number of positions. The 498 trades inside the P1 to P99 range generated about $1.12M in profits, while the 12 tail trades outside that range netted roughly -$536K. This means his profitability came from the repeatability of small wins, but the month was materially held back by a handful of large losing outliers.
Case Study - Understanding Cool Russell’s Position Management#
This month we chose Cool Russell for the case study to offer a different perspective from previous reports. While the other featured traders generate returns through a more concentrated positioning, Cool Russell represents a fundamentally different approach, and one that users considering copy trading him should understand well.
Cool Russell has been consistently profitable for several months and maintains a solid win rate (65.9% in March). But his average PnL per position was only about $1,150 across 510 closed trades. That number is very low relative to his notional sizes, which regularly reach $5M to $15M per position. His edge comes from volume and repetition, not from large individual payoffs.
To illustrate how he trades, we examined his three worst and two best positions of the month. All five were short positions, and all five show the same underlying behavior.
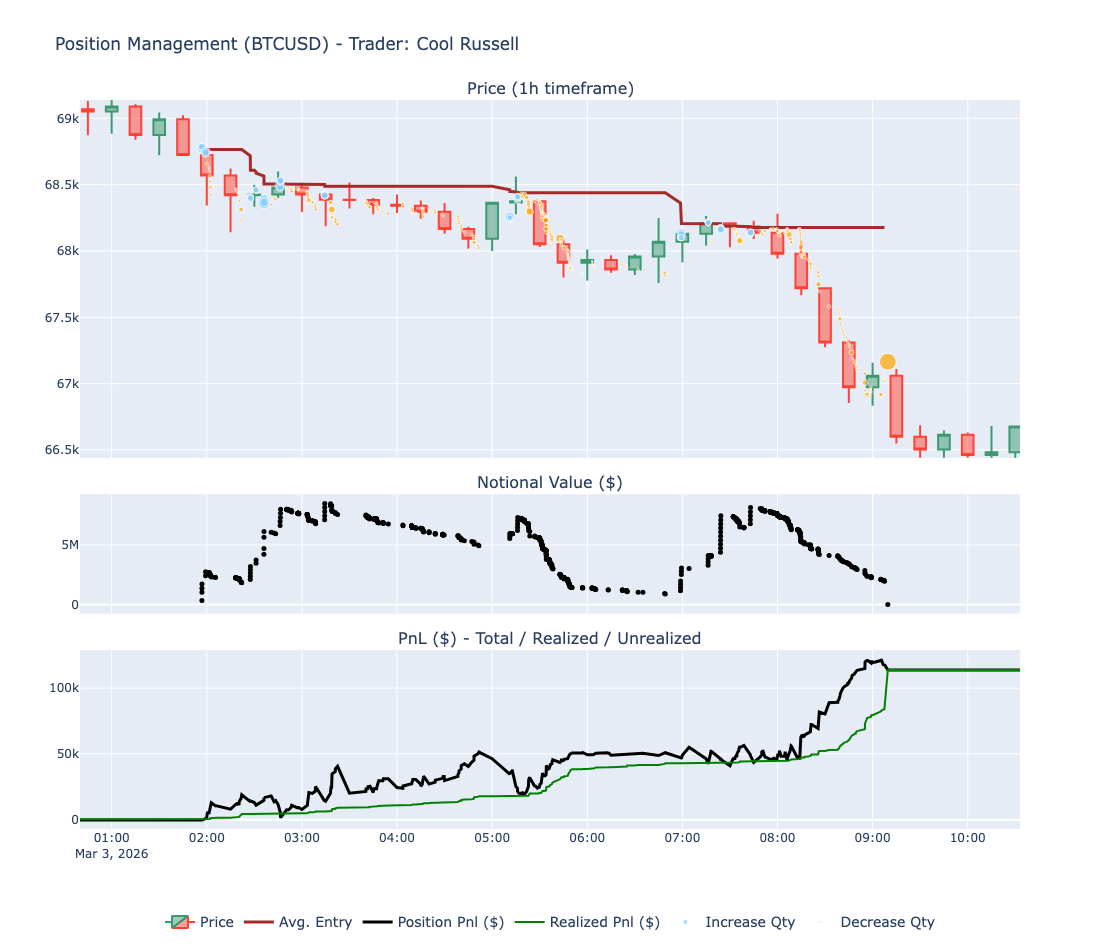
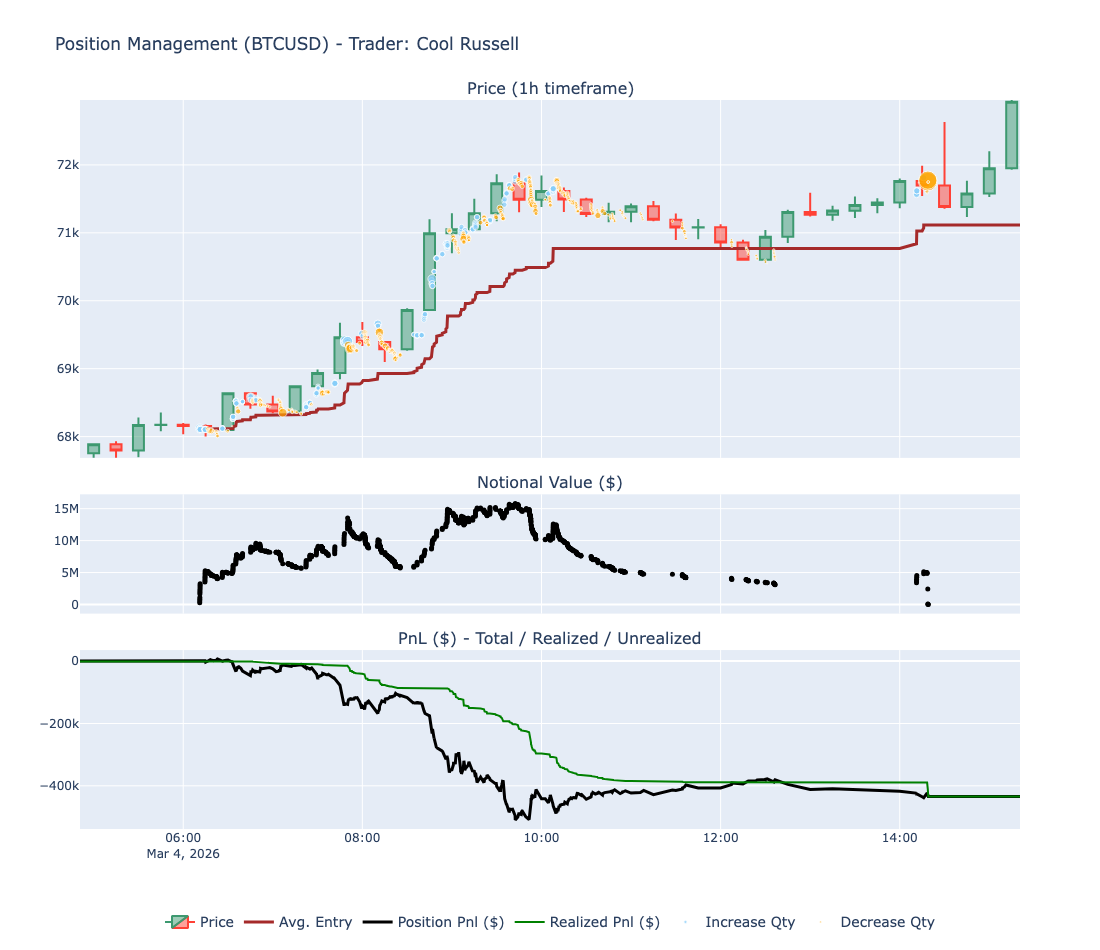
Cool Russell manages each position continuously from open to close. As price moves against his short (i.e. price rises), he increases his position size, averaging into the move. As price moves in his favor (i.e. price drops), he reduces his position, locking in partial profits along the way. This pattern is consistent across both winning and losing trades.
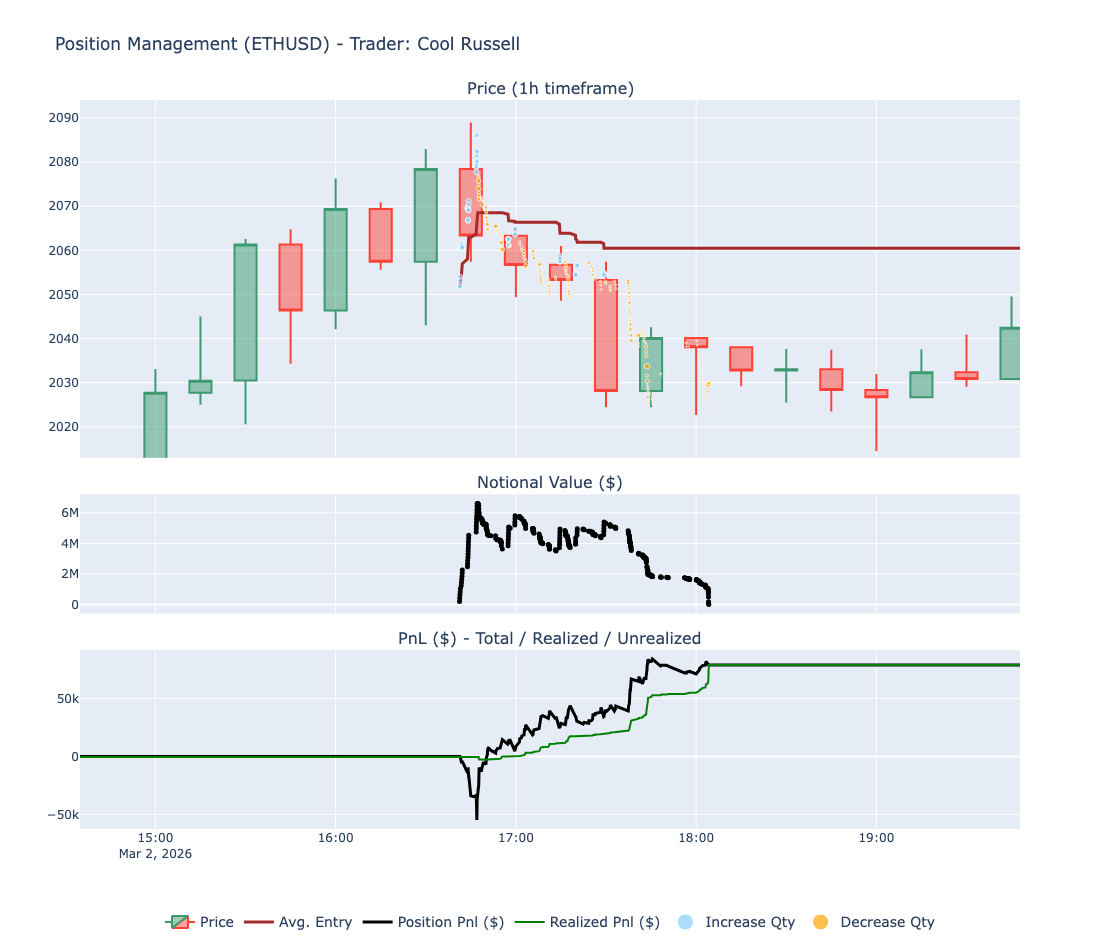
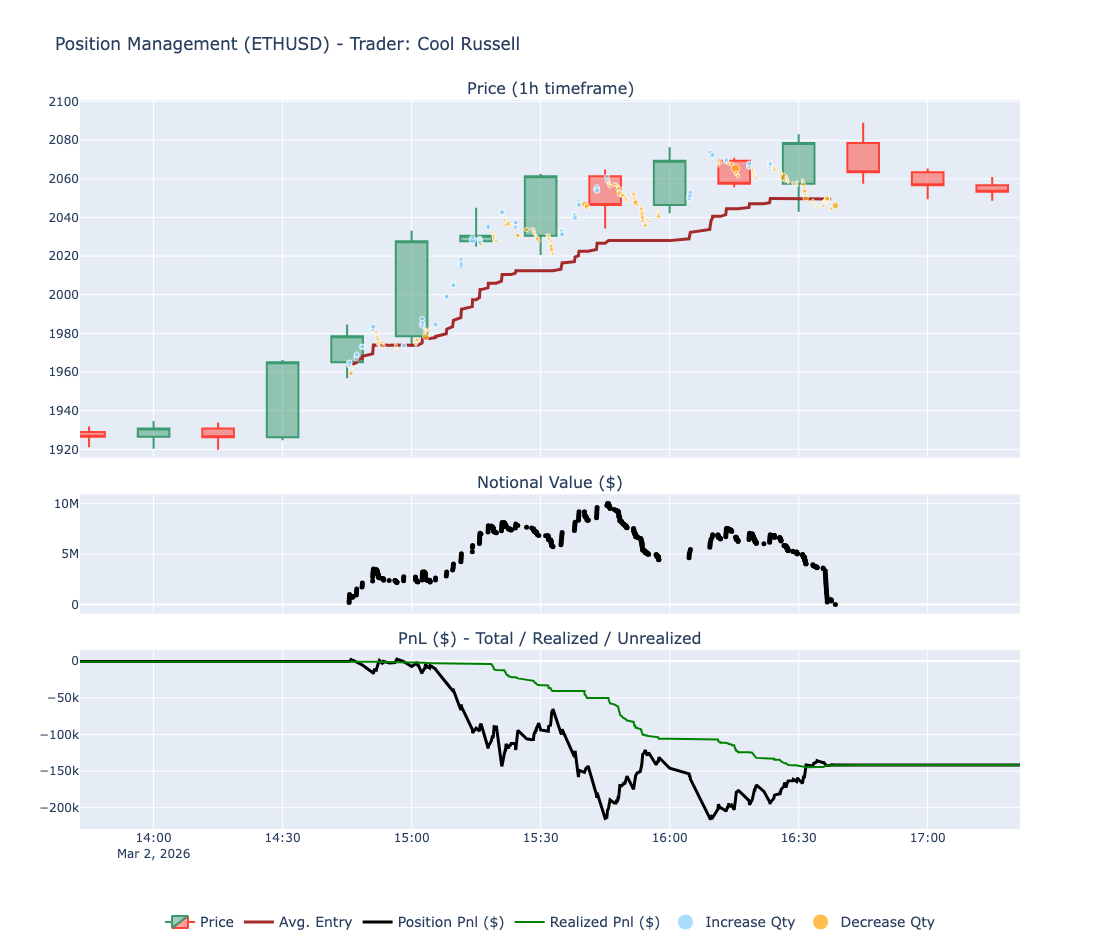
On winning trades, this approach works well. He enters a short, price drops, and he progressively takes profits on the way down. The realized PnL line rises steadily as he scales out. On the March 3 BTC short, for example, he built notional exposure up to roughly $7M as price fell from $69K to $66.5K, locking in approximately $110K in realized profit over about 8 hours. The same pattern is visible in the March 2 ETH short, where he captured roughly $70K as ETH dropped from $2,070 to $2,030.
On positions that do not revert quickly and keep moving against his direction, this same approach allows him to continuously move his average entry price closer to the current price, always increasing size on the way up and decreasing when price pulls back in his favor. However, for the few positions where price moved substantially and persistently against him, this had the effect of accumulating large losses.
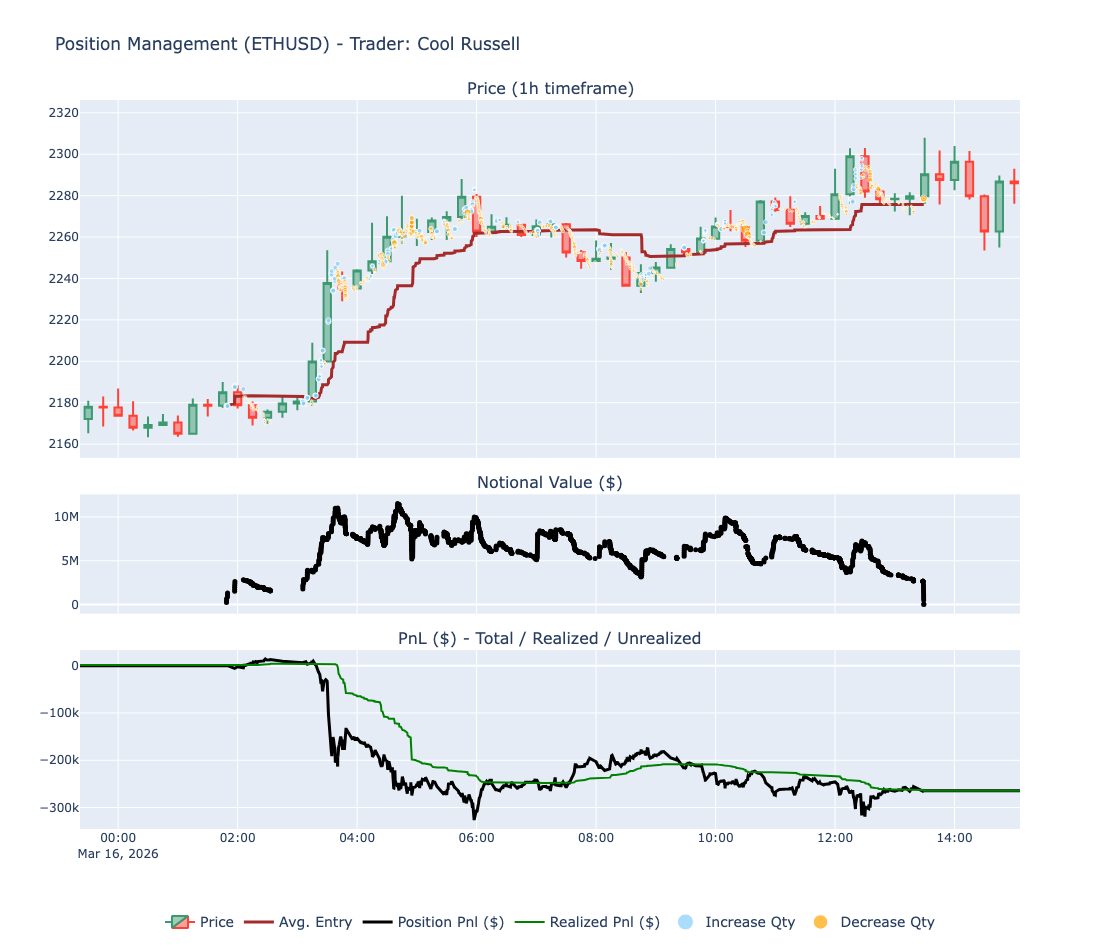
On the March 4 BTC short, for example, he scaled his notional up to approximately $15M as BTC rallied from $68K to over $71K, closing the position at roughly -$430K. The same dynamic played out on the March 16 ETH short (-$270K) and the March 2 ETH short (-$150K). These three trades alone accounted for about -$850K, enough to cut deeply into the profits accumulated across hundreds of smaller wins.
This explains the PnL distribution we saw earlier: the 498 positions inside the P1 to P99 range generated about $1.12M, but just 12 outlier trades netted roughly -$536K, giving back nearly half the gains. The month's realized profit of $586K came from the high volume of small wins overcoming a handful of outsized losses.
For users considering copy trading Cool Russell, this is important context. His strategy produces a high win rate and consistent small gains most of the time, but it carries meaningful tail risk from a small number of positions that move far against him before reverting. This means the equity curve can experience sharp drawdowns even during an otherwise profitable period. Prospective copiers should expect this volatility and size their allocation accordingly.
Conclusion#
March’s top three show three very different ways to produce profits.
Shadow Wallaby generated the strongest result through a concentrated, high-notional swing book with gains heavily concentrated in $XRP and $BTC.
Cosmic Venom delivered the cleanest quality of returns, with a smaller but highly efficient long-only style that produced profits across almost every symbol traded.
Cool Russell remained the highest-volume trader, relying on thousands of small edges across 510 positions, although as the case study illustrates, a handful of outsized losses from his scaling approach significantly reduced what would otherwise have been a much bigger month.
Follow our highlight traders on Twitter:
- Shadow Wallaby: please if you know, let us know his twitter handle
- Cosmic Venom: please if you know, let us know his twitter handle
- Cool Russell: please if you know, let us know his twitter handle
Join Mirrorly: https://portal.mirrorly.xyz/
Subscribe to our Notifications so you don't miss next month's report!