
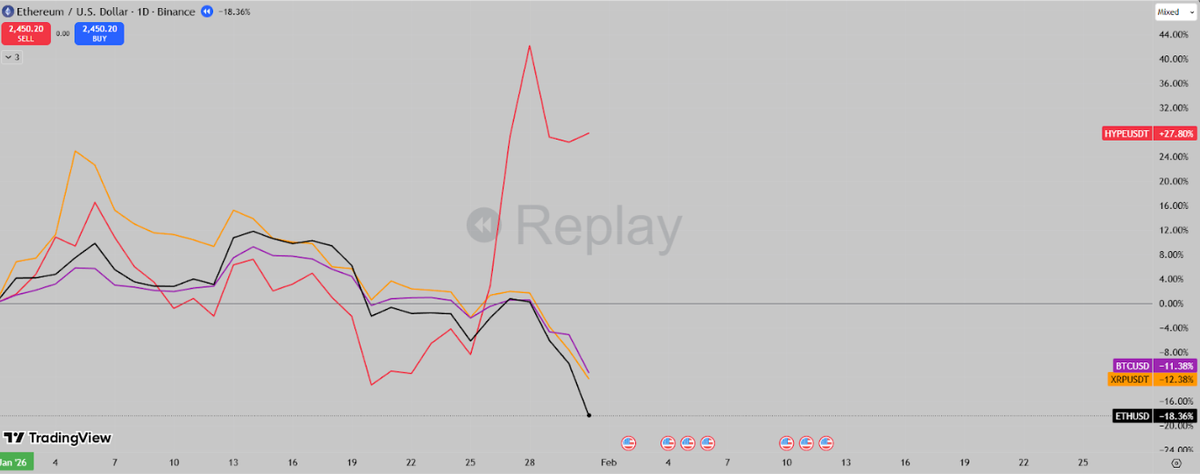
January started on the front foot. $BTC opened the month at $87,500 and pushed higher through the first two weeks, reaching a local high near $98,000 around January 14. But the rally didn't stick. From mid-January onward, momentum reversed and sellers took control. BTC grinded lower through the second half of the month, eventually hitting a low of $75,600 before closing January at $78,648, down roughly 10%.
$ETH had it worse. After briefly touching $3,400 early in the month, it fell to a low of $2,250 and closed at $2,452, a 17.5% decline. The ETH/BTC ratio dropped 8%, continuing a trend of $ETH underperformance that defined much of the period. Altcoins were broadly weak, with early strength in names like $XRP fading quickly as the selloff deepened. The notable exception was $HYPE, which rallied hard from January 21 through month end, diverging from the broader market.
The structure of the move mattered. Two weeks of upside made it easy to stay bullish, and the mid-month reversal was gradual enough to trap longs before accelerating into month end. Traders who recognized the turn early and built short exposure through the middle of the month had a clear edge. Those who also caught the late-month $HYPE breakout added a second leg of profit on top of their bearish positioning.
Mirrorly's top traders navigated this well, delivering strong performance through a combination of timely short positioning and selective long exposure where strength emerged.
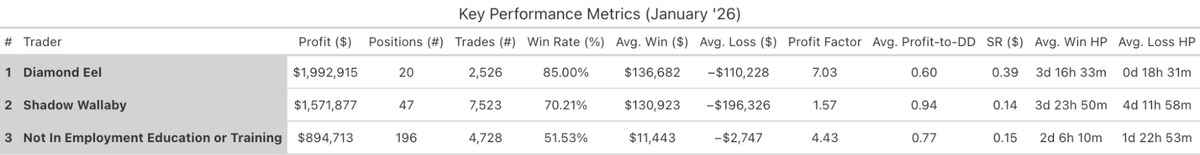
This month Mirrorly’s top 3 traders are:
🏆Diamond Eel (Hyperliquid): +$1.9M
🥈 Shadow Wallaby (Hyperliquid): +$1.6M
🥉Not In Employment Education or Training (Hyperliquid): +$900k
Diamond Eel led the month with nearly $2M in profit across just 20 closed positions, achieving the highest win rate of the three at 85%. His profit factor of 7 was also the strongest, reflecting a significant edge per trade. Average winners ($137k) were held for nearly 4 days, while average losers ($110k) were cut in under 19 hours. The average win/loss ratio of approximately 1.24, combined with the high win rate, produced consistent returns despite a modest number of positions.
Shadow Wallaby closed 47 positions with a 70% win rate and $1.6M in profit. The trade count (7.5k across those positions) was the highest of the three, suggesting active scaling or position management throughout the month. Notably, his average loss ($196k) exceeded his average win ($131k), giving an average win/loss ratio of approximately 0.67, meaning the high win rate compensated for occasional larger drawdowns. Holding periods were relatively balanced, with winners held just under 4 days and losers around 4.5 days. His profit-to-drawdown ratio of 0.94 was the highest of the three.
Not In Employment Education or Training (NEET) was by far the most active, closing 196 positions with 4.7k trades, but recorded the lowest win rate at 51.5%. Despite the near coin-flip win rate, he achieved a profit factor of 4.43, driven by an average win/loss ratio of approximately 4.2, meaning his winners were, on average, more than four times larger than his losers. Holding periods were fairly balanced at around 2 days for winners and just under 2 days for losers.
Trader Spotlight: Diamond Eel#
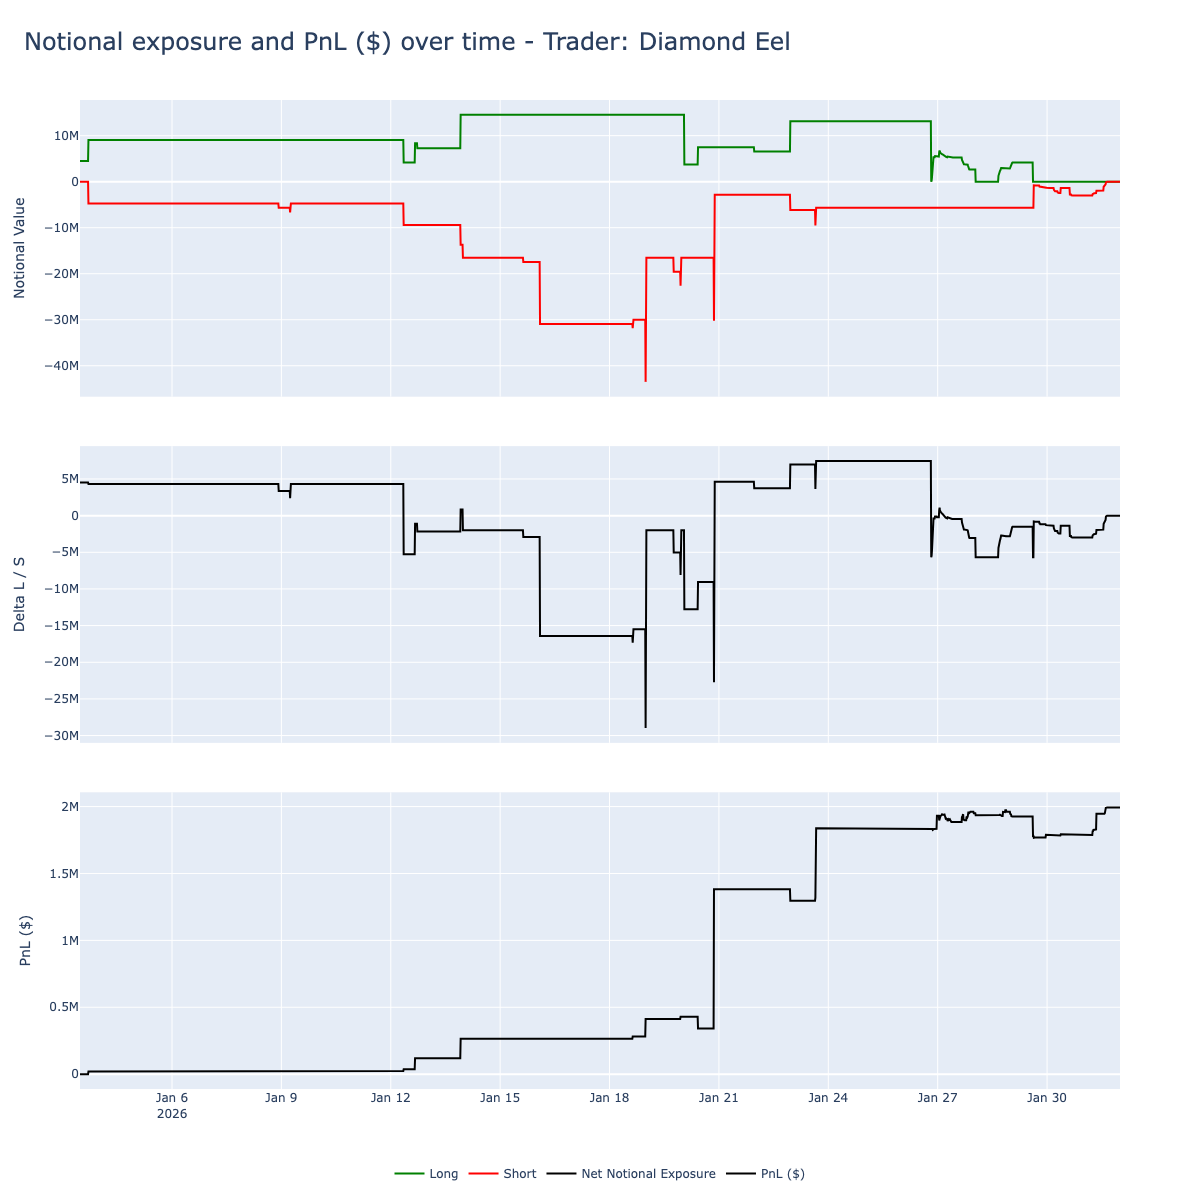
Diamond Eel started the month with a long bias, maintaining long notional around $8–10M and relatively modest short exposure near –$5M. His net exposure hovered around +$5M for the first ten days.
Around January 12, he began building significant short positions, driving short notional down to approximately –$35M and net exposure to roughly –$30M by January 18–19. This aggressive short positioning coincided with the strongest phase of PnL acceleration, as his cumulative profit jumped from around $300K to over $1M. He then flipped back to net long around January 20–21, and from January 24 onward, maintained a more modest and balanced position, closing the month with $2M profits.
He traded seven symbols, with $XRP dominating his activity; a short position opened in mid-January accounted for the majority of his PnL. His remaining positions were concentrated in mid-cap and large-cap names ($BCH, $DOGE, $ETH, $SUI), with selective short exposure to $FARTCOIN and $HYPE in the final days of the month.
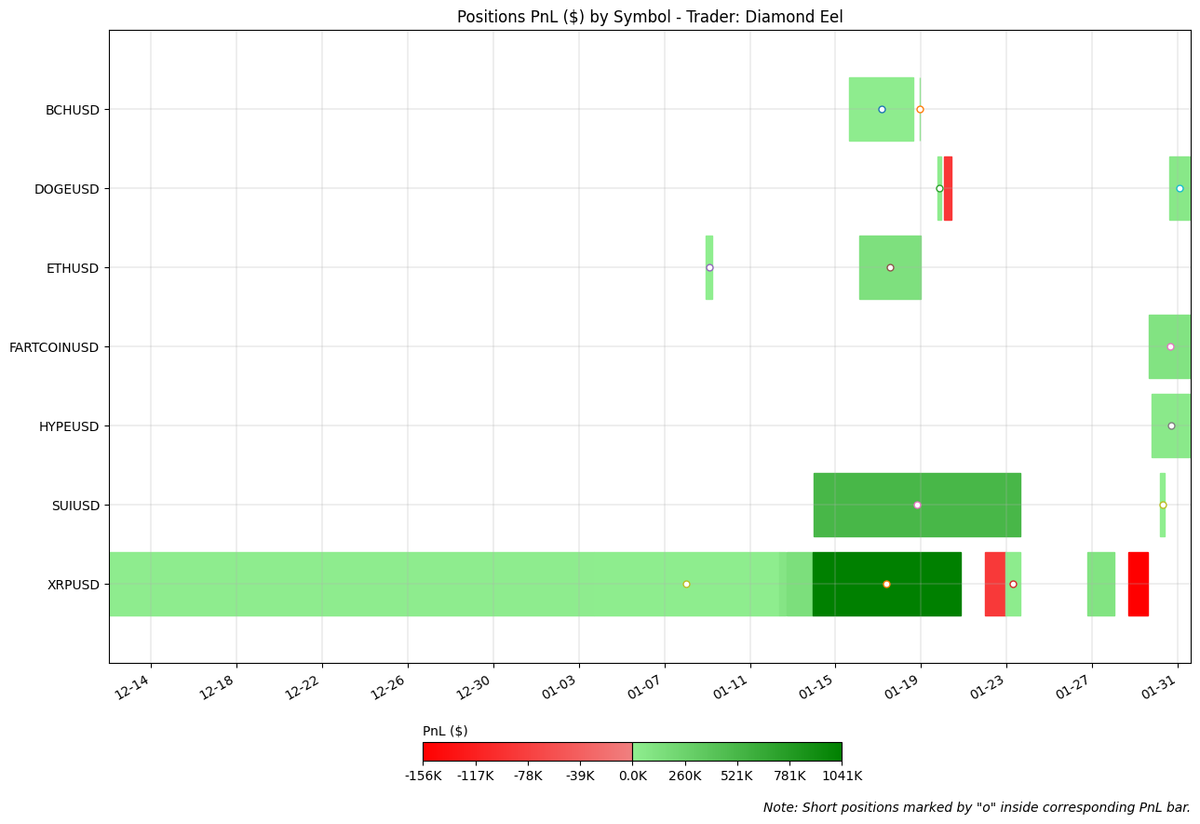
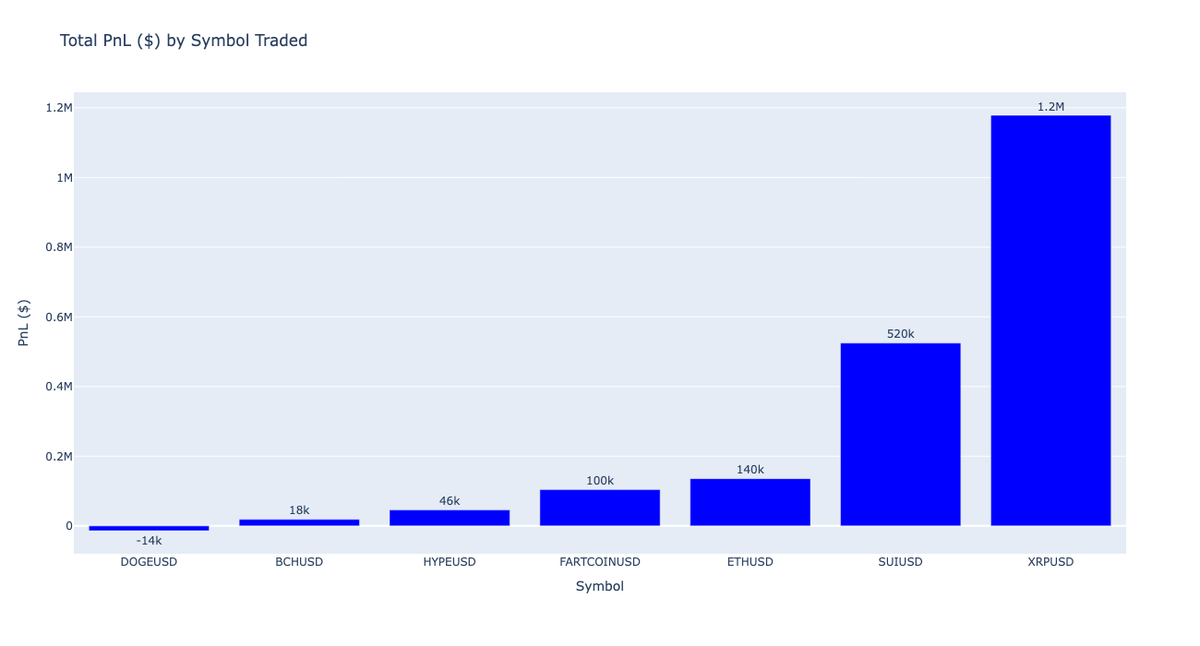
Looking at PnL by symbol, $XRP was Diamond Eel's dominant contributor at $1.2M, followed by $SUI at $520K, and together accounting for roughly 86% of his total monthly profit. He was profitable on six of seven symbols traded, with $DOGE being the only loser at –$14K.
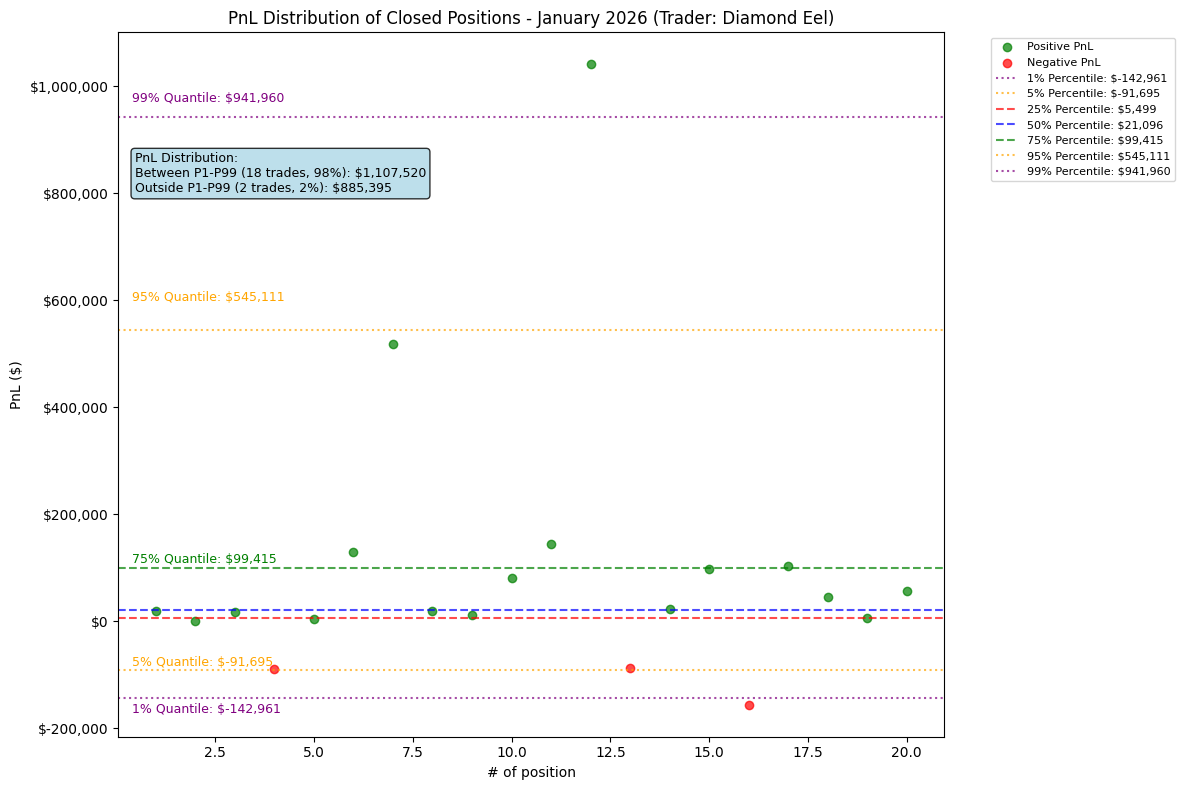
He showed a strongly positive-skewed distribution, with the 75th percentile at +$99K versus +$5.5K at the 25th, an 18x ratio. His median trade was +$21K, indicating that most positions were profitable on average. Looking at the contribution of outlier trades: positions outside the P1–P99 range accounted for $885K, or roughly 44% of his total realized PnL, while the remaining 18 trades within P1–P99 contributed $1.1M. This means nearly half of his monthly profit came from just two positions.
Trader Spotlight: Shadow Wallaby#
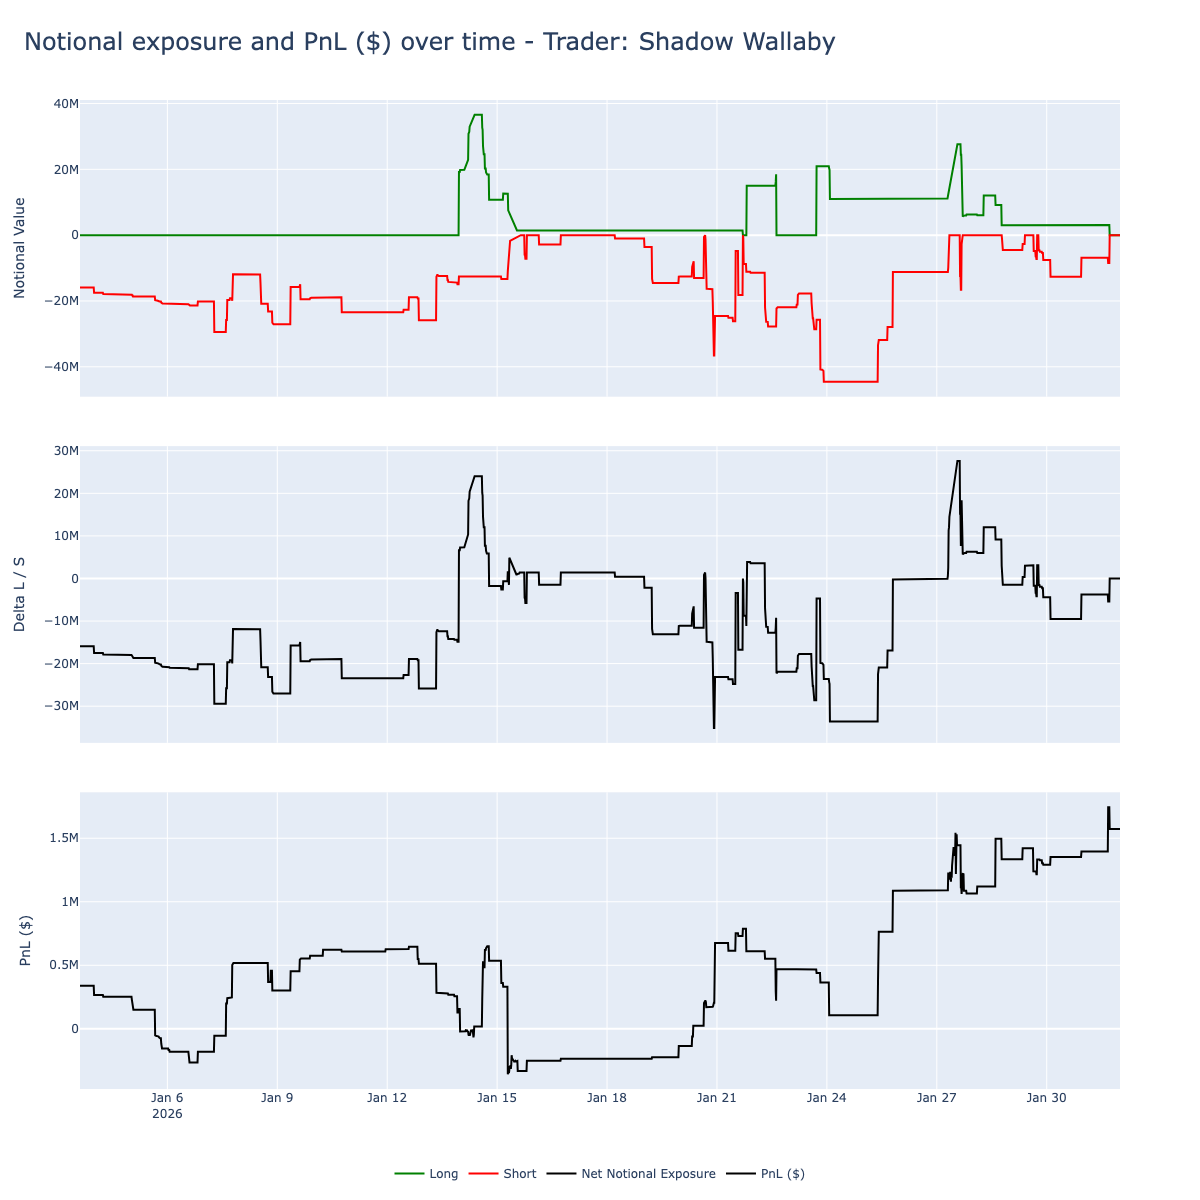
Shadow Wallaby showed the most dynamic positioning of the three. He began the month heavily net short, with short exposure around –$15M to –$30M and minimal long exposure for the first 12 days. Around January 13, he quickly flipped long, with long notional spiking to almost $40M and net exposure reaching approximately +$25M. However, this reversal was only temporary, by January 15 he rotated back to net short, and his PnL retraced into negative territory around –$200K. Through mid-month, he oscillated between net short and neutral, with PnL recovering to about $500K. The strongest performance came in the final week: from January 24, he built long exposure to nearly $30M, and his PnL accelerated from around $600K to over $1.5M by month end.
Shadow Wallaby traded nine symbols, primarily major assets. As noted earlier, the strategy was heavily skewed toward shorts, while nearly every long position ended in a loss.
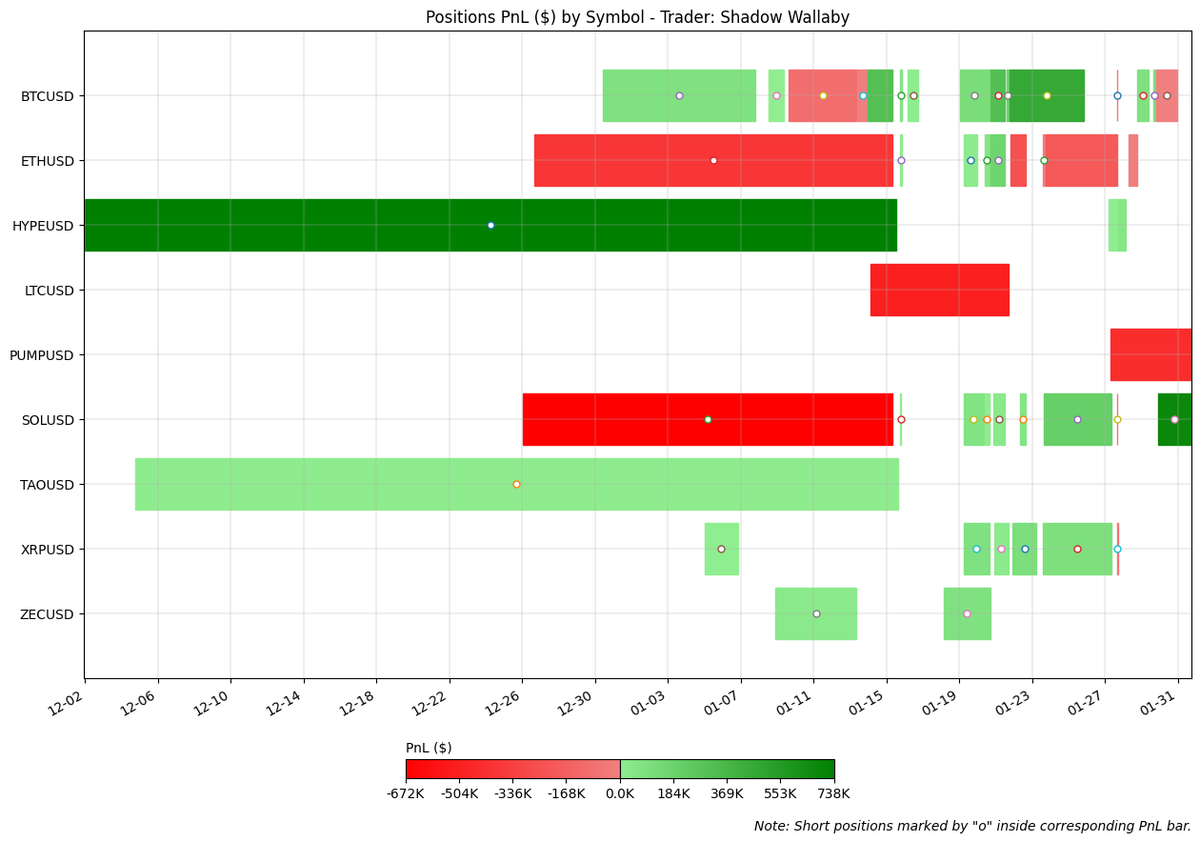
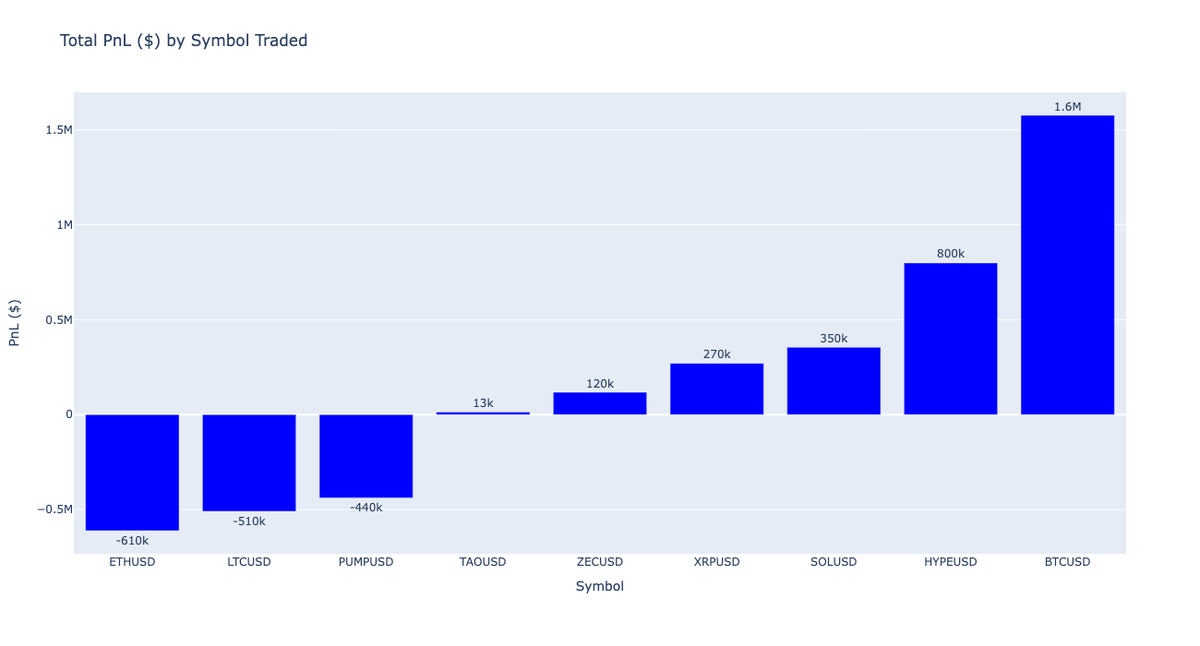
His top three contributors were $BTC (+$1.6M), $HYPE (+$800K), and $SOL (+$350K), totaling $2.75M in profits. However, this was partially offset by significant losses on $ETH (–$610K), $LTC (–$510K), and $PUMP (–$440K), which combined to –$1.56M. The winning side was roughly 1.8 times larger than the combined losses.
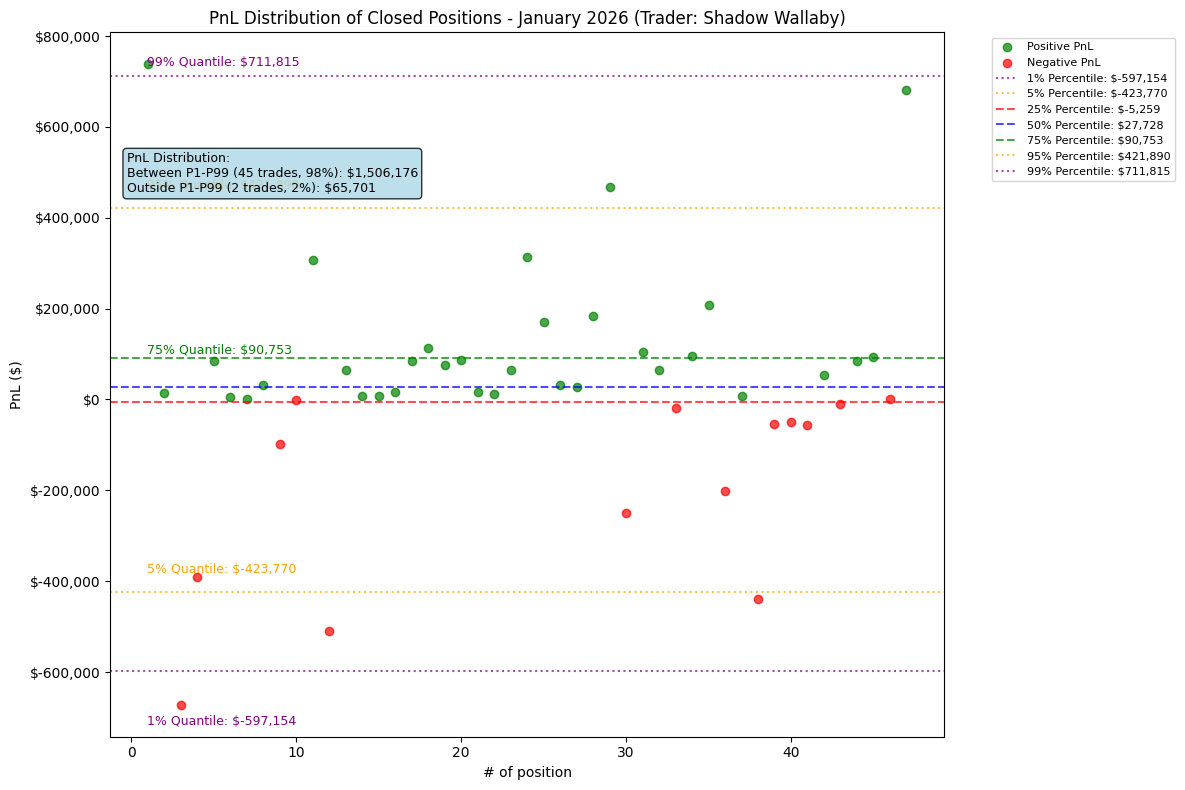
Shadow Wallaby exhibited the widest dispersion of the three, with outcomes ranging from approximately –$680K to +$690K. His distribution is relatively symmetric at the extremes: the ratio between the 99th percentile ($712K) and the 1st percentile (–$597K) is only 1.19, indicating that his largest winners were not dramatically larger than his largest losses.
The positive skew instead emerges in the mid-range, where the 75th percentile (+$91K) far exceeds the 25th (–$5.3K). Nearly all of his profits ($1.5M, or 96%) came from trades within the P1–P99 range, with outliers contributing only $66K.
Trader Spotlight: NEET (Vault)#
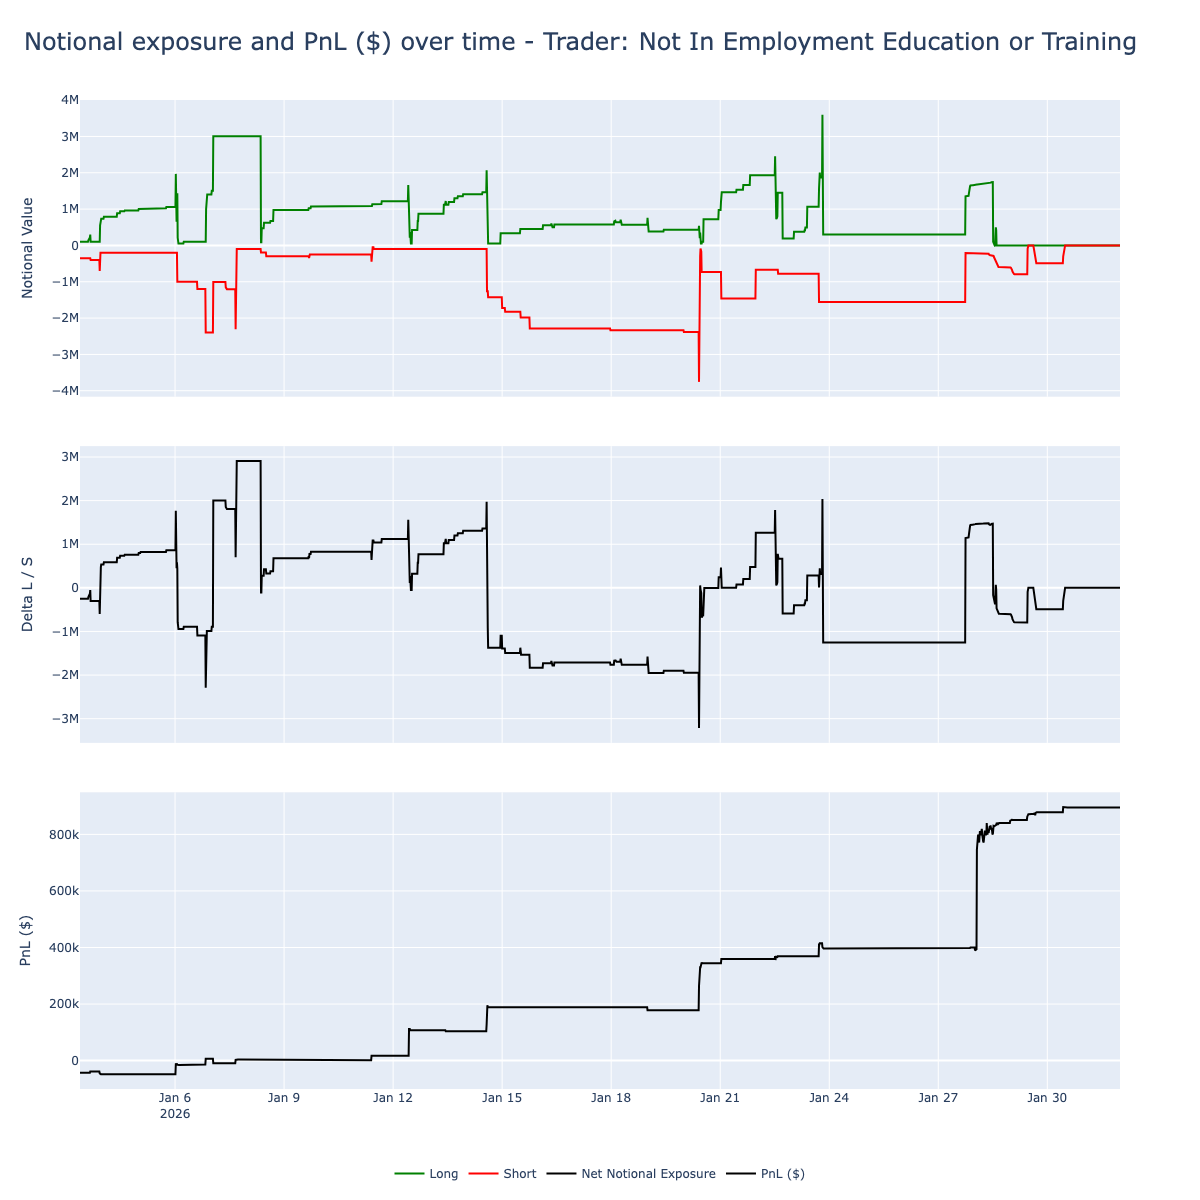
Not In Employment Education or Training (NEET) operated at much smaller notional than the other two, with long exposure typically between $500K and $2M and short exposure rarely exceeding –$3M. His net exposure fluctuated frequently between roughly +$3M and –$3M, with the portfolio consistently maintained in a long/short-hedged configuration.
Despite the smaller scale, his PnL curve shows steady, almost mechanical accumulation throughout the month, increasing gradually from near zero to approximately $400K by January 23. A fast acceleration in the final days of January drove his total to roughly $900K.
NEET traded the broadest universe of the three by a wide margin. His activity spanned majors ($BTC, $ETH, $SOL), memecoins ($1000BONK, $1000PEPE, $FARTCOIN, $POPCAT, $MEW), AI-related tokens ($RENDER, $FET), L1s ($SUI, $AVAX, $ADA), DeFi names ($AAVE, $ENA, $LDO), and more. Most positions were small and short-lived, reflecting the high number of trades and frequent position rotation.
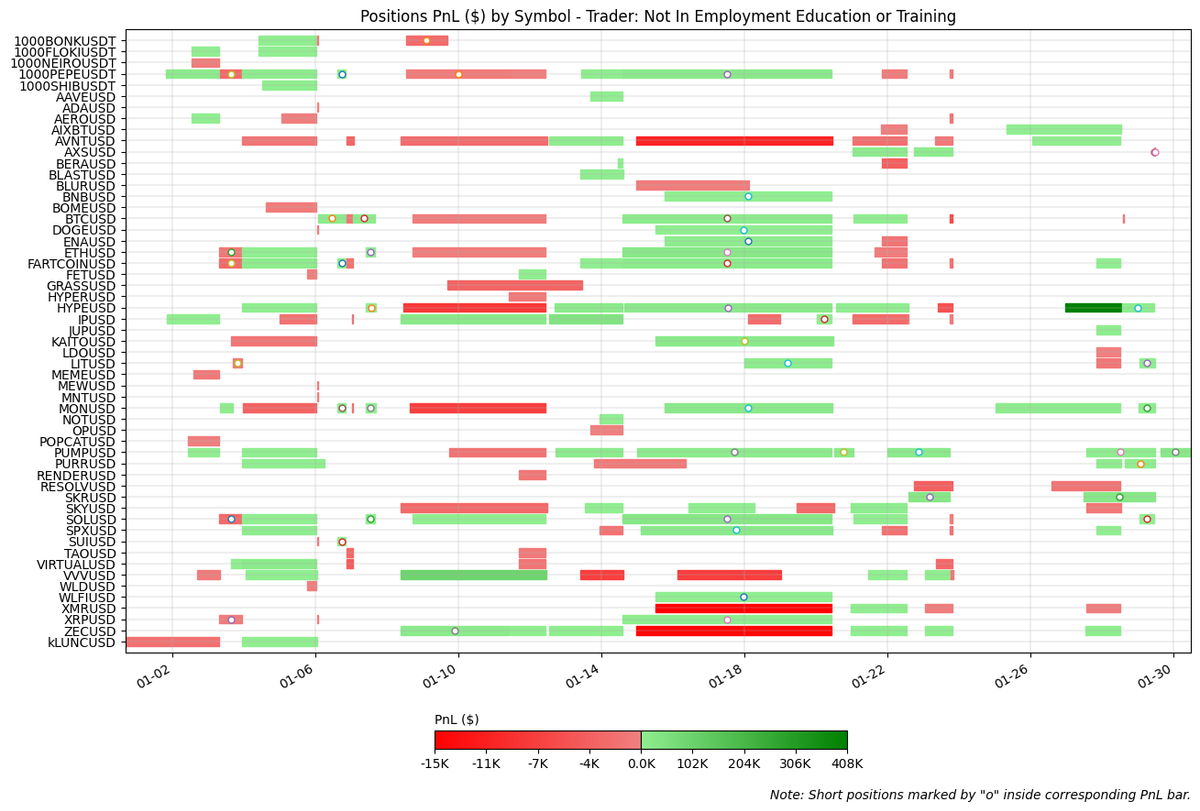
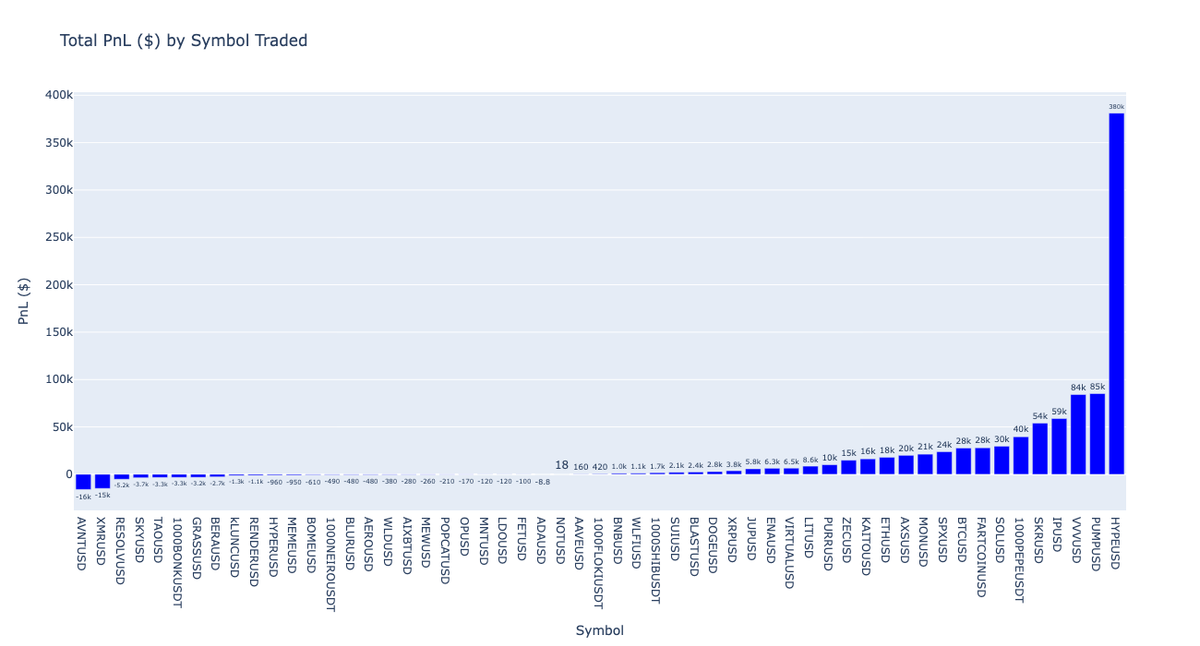
$HYPE was the most profitable symbol for NEET, contributing $380K, roughly 42% of his total monthly PnL. Beyond that, profits were spread across a long tail of smaller winners, with $PUMP ($85K), $VVV ($84K), and $IP ($59K) the next largest. Losses were minimal, with no single symbol exceeding –$16K.
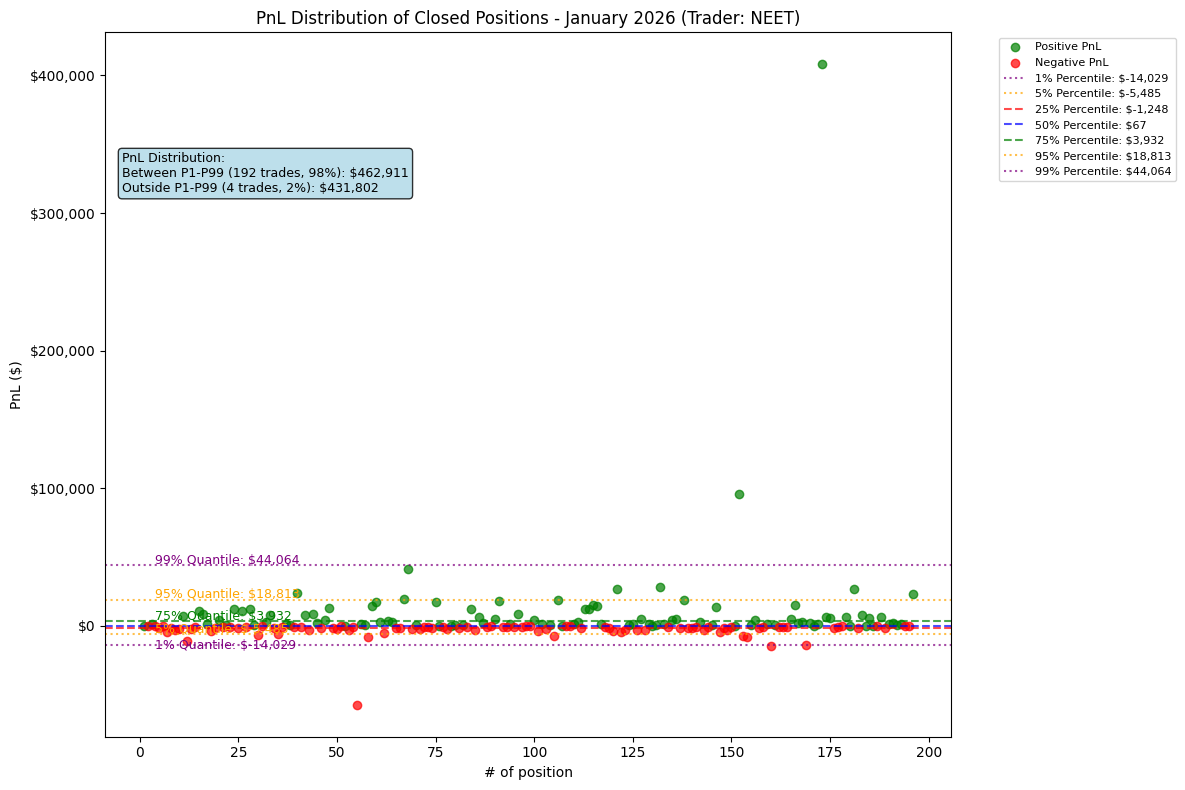
NEET displayed a tightly clustered distribution consistent with his high number of closed positions. The median trade was near breakeven (+$67), and the middle 50% of trades ranged from –$1.2K to +$3.9K.
Nearly half of his total PnL came from just 4 trades outside the P1–P99 bounds ($432K out of $895K), driven primarily by a single outsized winner near $410K. His largest single loss (approximately –$70K) was a clear outlier relative to the otherwise narrow distribution.
Case Study - NEET: Positioning Patterns and PnL Outcomes#
Among the traders covered in this report, NEET emerges as the most interesting profile. Throughout January, the vault’s PnL increased steadily with limited drawdowns and low volatility, in line with a long/short strategy, careful symbol selection, and balanced sizing.
Activity was skewed toward the long side, with 147 long positions closed versus 49 shorts. Across the month, NEET traded 52 symbols on the long side and 23 on the short side: 20 were traded in both directions, 32 were long-only, and just three were short-only, highlighting a structurally bullish bias expressed alongside tactical hedging.
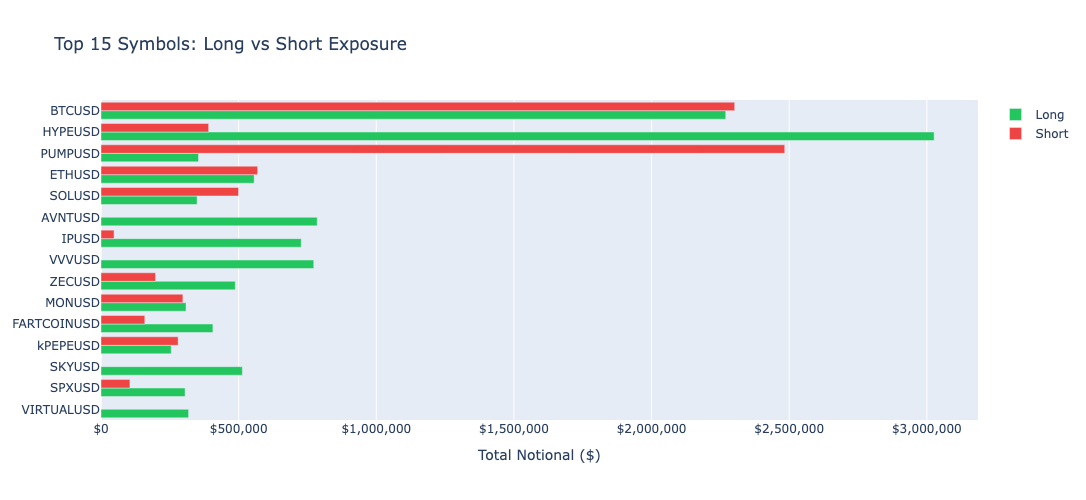
Looking at the top 15 symbols by total notional exposure, $BTC, $HYPE, and $PUMP dominated. $BTC was run with near-symmetric long and short exposure. $HYPE was heavily tilted toward longs, while PUMP showed the opposite pattern, with a clear preference for shorts.
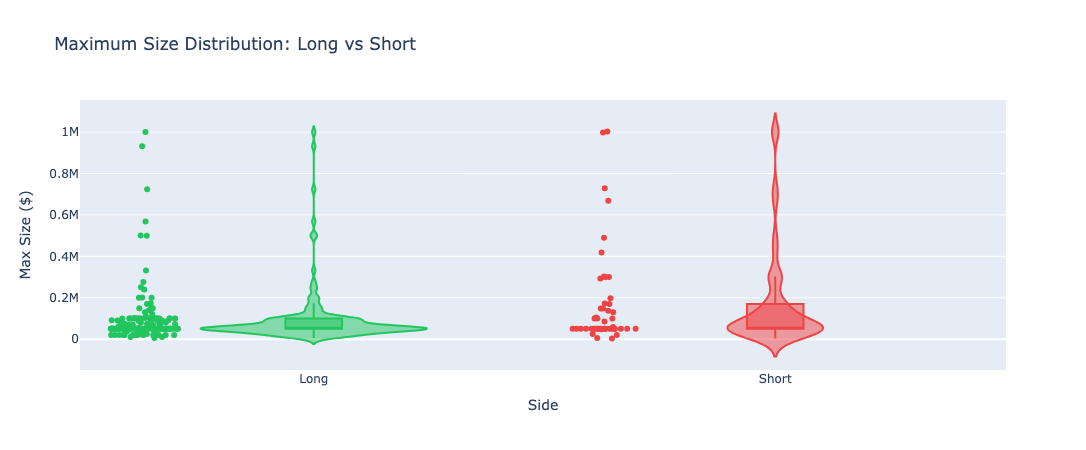
The distribution of maximum position notionals reinforces this balanced construction. Median notional exposure for both longs and shorts sits around $50k, and the tails of the distributions appear broadly similar, as illustrated by the violin plots; likely, a signal that position sizing is kept symmetrical across directions despite directional views at the symbol level.
Finally, the win/loss percentile analysis reveals a consistent rising ratio across the distribution, pointing to a pronounced positive skew: losses remain contained while winners expand meaningfully in the upper percentiles.
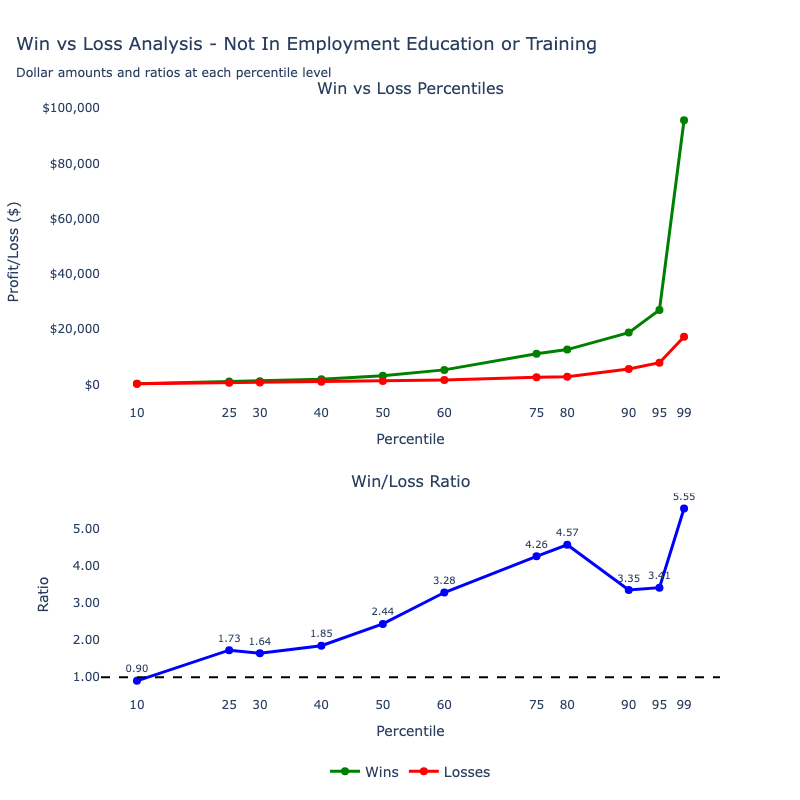
This asymmetry is consistent with the average win/loss ratio of 4.2, and helps explain the smooth PnL curve observed over the month.
Conclusion#
January was a month that punished stubbornness and rewarded adaptability. After two weeks of upside lured many into a bullish stance, the mid-month reversal separated traders who could read the shift from those who stayed anchored to a thesis that was no longer working.
The three profiles this month illustrate distinct routes to similar outcomes. Diamond Eel ran a concentrated book of 20 positions, leaning into a high-conviction $XRP short while cutting losses quickly. Shadow Wallaby was the most aggressive, flipping between long and short, enduring a mid-month drawdown before recovering into month end. NEET traded far smaller in size but compensated with breadth, generating roughly $900K across 196 positions and more than 25 symbols through steady accumulation.
What connects them is not a shared strategy but a shared ability to adjust as conditions shifted. Whether through conviction, aggression, or volume, each found a way to extract profit from a market that gave most participants nothing but pain.
Follow our highlight traders on Twitter:
- Diamond Eel: please if you know, let us know his twitter handle
- Shadow Wallaby: please if you know, let us know his twitter handle
- NEET: https://x.com/theneetguy
Join Mirrorly: https://portal.mirrorly.xyz/
Subscribe to our Notifications so you don't miss next month's report!