
February unfolded as a broadly weak month for majors. BTC, ETH, and SOL all trended lower for most of the period, experiencing repeated selloffs and failing to sustain meaningful recoveries. BTC declined roughly 14% over the month, while ETH and SOL both lost about 17%. The market structure was characterized by persistent downside pressure punctuated by short-lived rebounds that quickly faded. One of the few assets to record a positive performance was HYPE, which gained roughly 7% over the month.
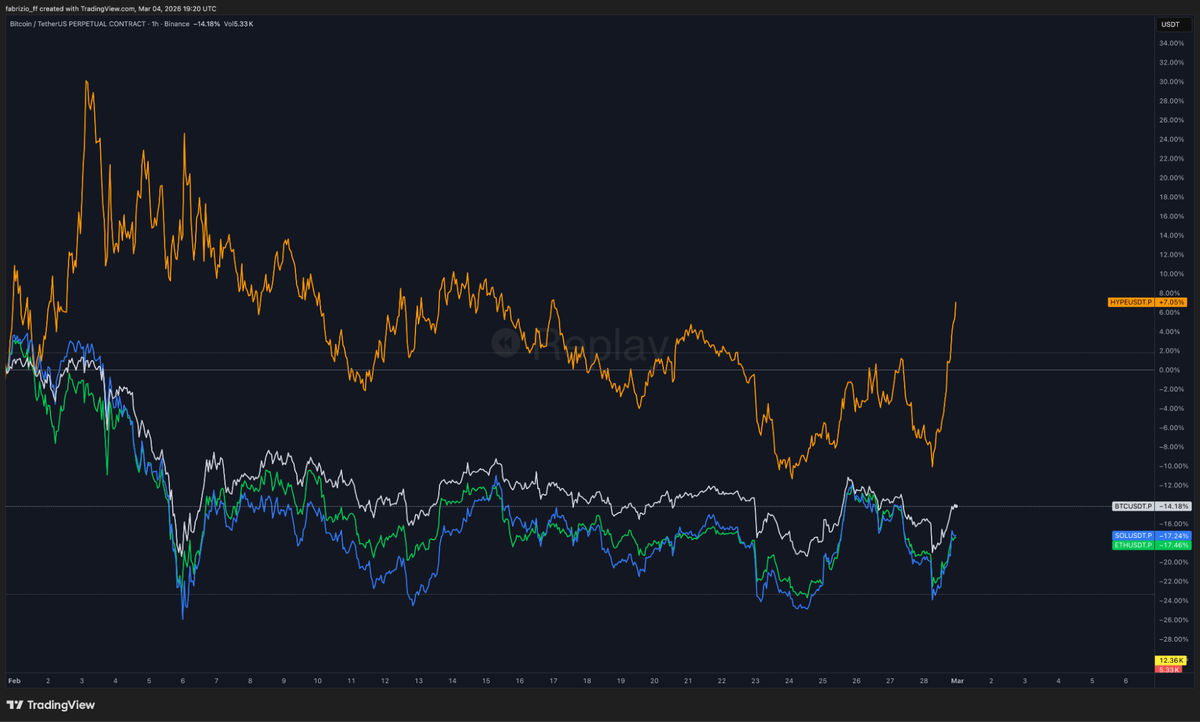
This dispersion created a challenging environment for directional trading, rewarding traders who could either capitalize on relative strength or manage exposure effectively during the broader downtrend.
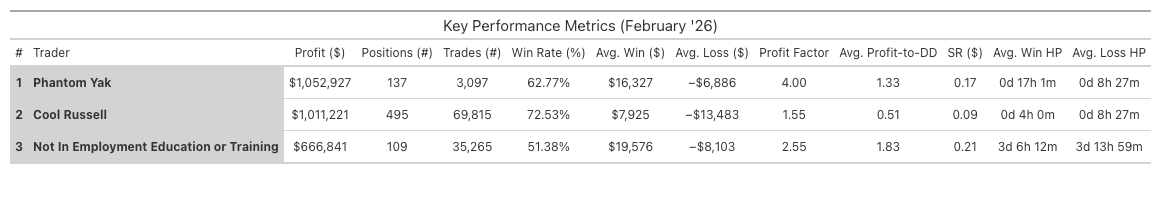
This month Mirrorly’s top 3 traders are:
🏆 Phantom Yak (Hyperliquid): +$1.05M
🥈Cool Russell (Hyperliquid): +$1.01M
🥉Not In Employment Education or Training (Hyperliquid): +$667k
Phantom Yak led the month with approximately $1.05M in profit across 137 closed positions, achieving a 62.8% win rate and the highest profit factor of the three at 4.0. His average win ($16.3K) was roughly 2.4 times his average loss ($6.9K), and winners were held nearly twice as long as losers (17 hours vs. 8.5 hours). This asymmetry, combined with an average profit-to-drawdown ratio of 1.33, implies he lets winners run while cutting losers relatively quickly.
Cool Russell closed the most positions (495) with the highest win rate (72.5%) and executed over 69.8k trades, suggesting extremely active scaling or position management throughout the month. His profit factor of 1.55 was the lowest of the three, consistent with the fact that his average loss ($13.5K) exceeded his average win ($7.9K) by a significant margin. In other words, the high win rate compensated for occasional larger losses. Holding periods were the shortest of the group, with winners held about 4 hours and losers about 8.5 hours. He finished February with $1.01M in realized profits.
Not In Employment Education or Training (NEET) again ranked among the top performers. In January, his results were driven by a strong payoff asymmetry, with average winners more than four times larger than losers despite a near coin-flip win rate. February showed a similar pattern. Across 109 positions he generated $667K in profit with a 51.4% win rate, while maintaining a solid profit factor of 2.55 and the highest average profit-to-drawdown ratio (1.83) among the group. His average win ($19.6K) remained more than double the size of his average loss ($8.1K), reinforcing the same approach of allowing profitable trades to run while limiting downside. Holding periods also remained relatively long, averaging over three days for both winning and losing trades.
Trader Spotlight: Phantom Yak#
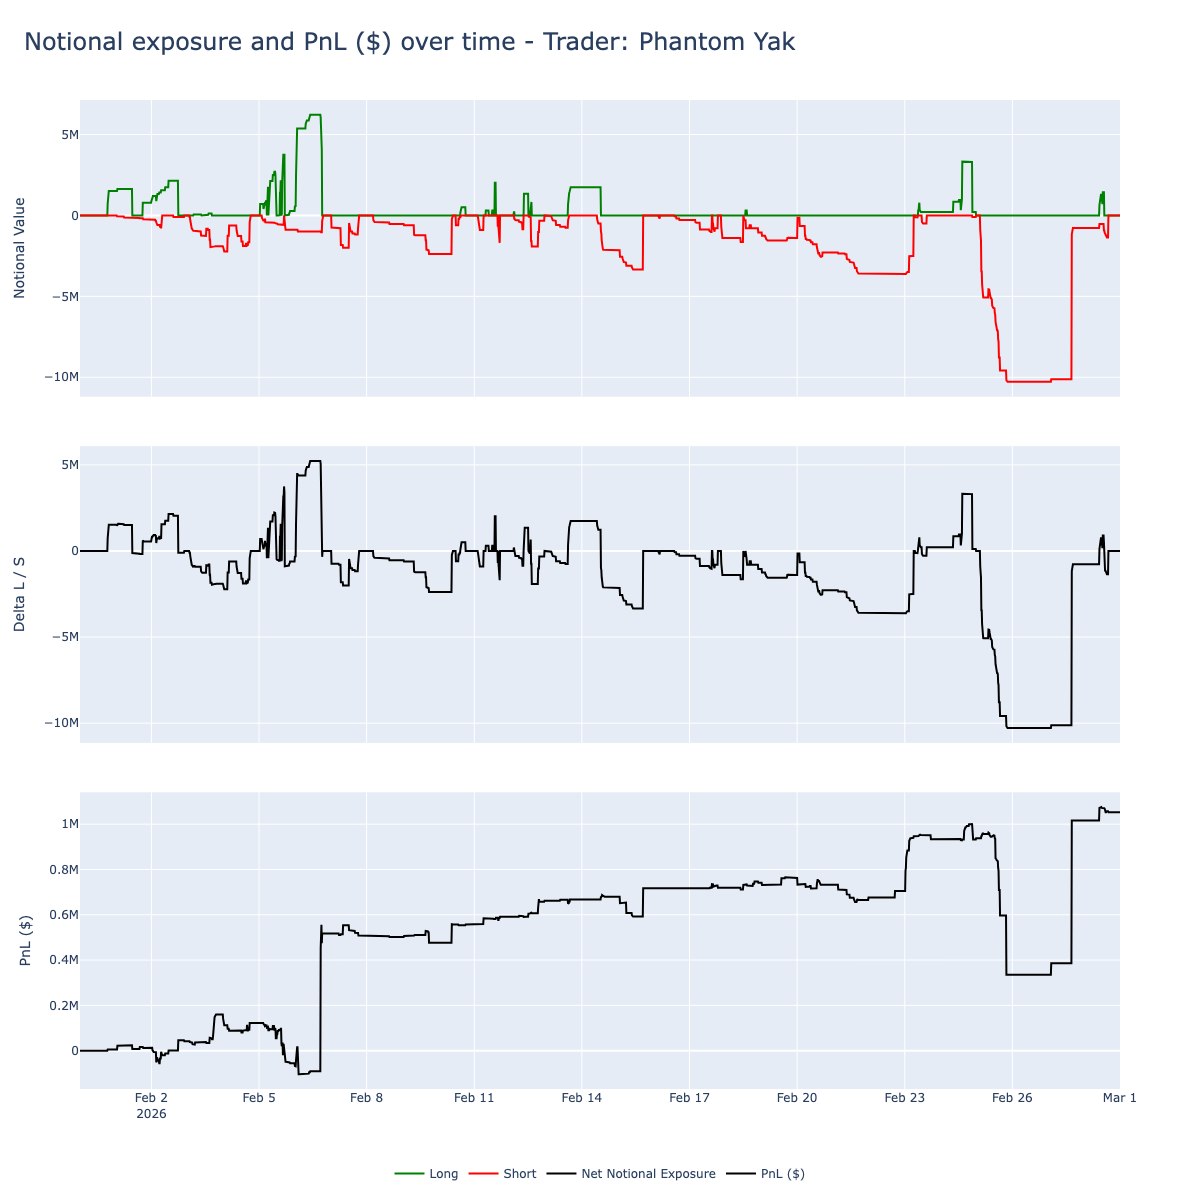
Phantom Yak started February with modest positioning before building significant long exposure around Feb 5, with notional increasing to approximately +$5M. This initial buildup coincided with a brief PnL dip below zero, followed by a quick recovery to roughly $500K.
From Feb 8 through Feb 23, he adopted a more balanced long/short approach, with exposure oscillating between +$2M and -$2M and net exposure shifting between mildly long and mildly short. His PnL curve shows steady, incremental accumulation during this phase, increasing from $500K to approximately $700K.
The most dramatic move came in the final days of the month: around Feb 25, he rapidly shifted to a significant net short position, with net exposure dropping to approximately -$10M. His PnL briefly dipped from around $850K to $400K before a quick rebound brought him to roughly $1.05M by month end.
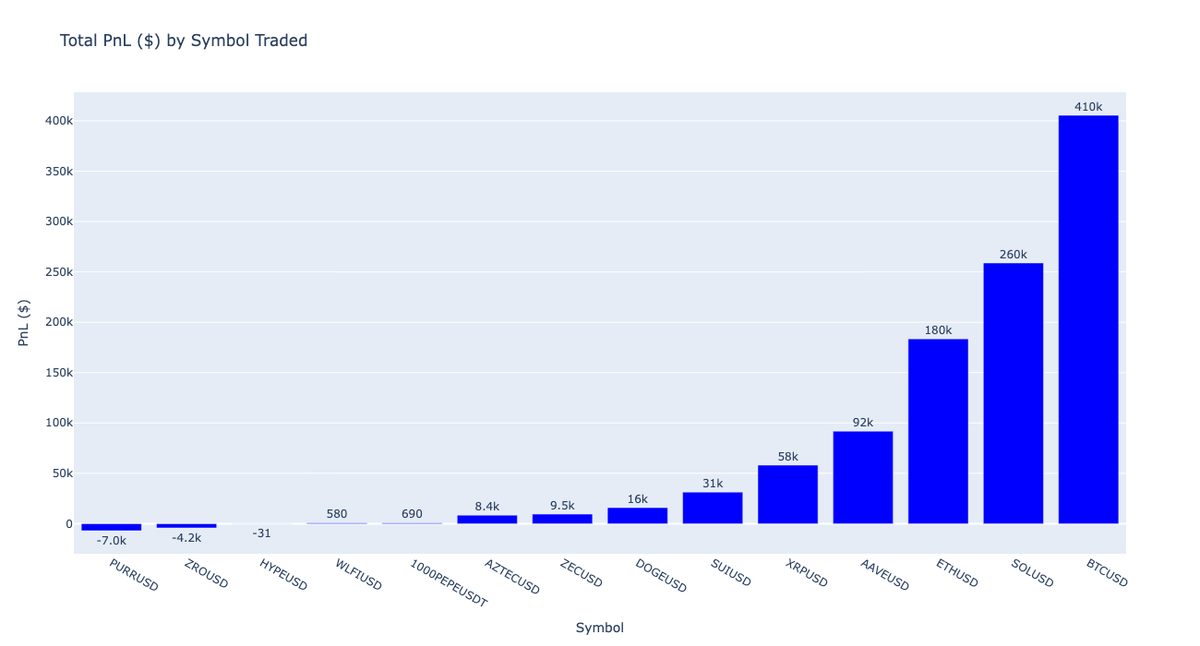
He traded 14 symbols, primarily majors (BTC, ETH, SOL) alongside HYPE, XRP, SUI, and AAVE. Activity was well-distributed throughout the month, with BTC and ETH showing the most frequent positioning.
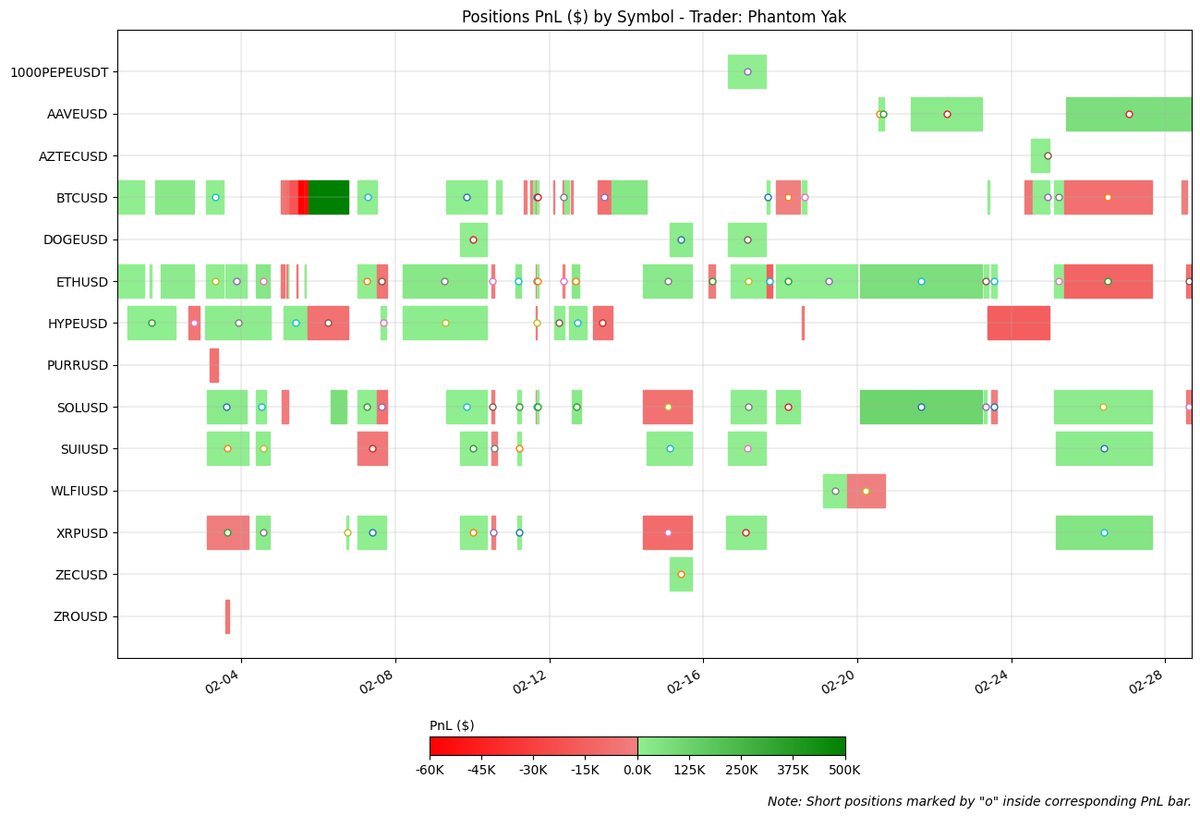
His largest gains came from BTC (+$410K), SOL (+$260K), and ETH (+$180K), which together accounted for approximately $850K, about 80% of his total realized profits. Only three symbols finished negative: PURR (-$7K), ZRO (-$4.2K), and HYPE (-$31), all representing near zero losses. The concentration of profits in major assets, combined with near-zero losses on losing symbols, is consistent with his high profit factor.
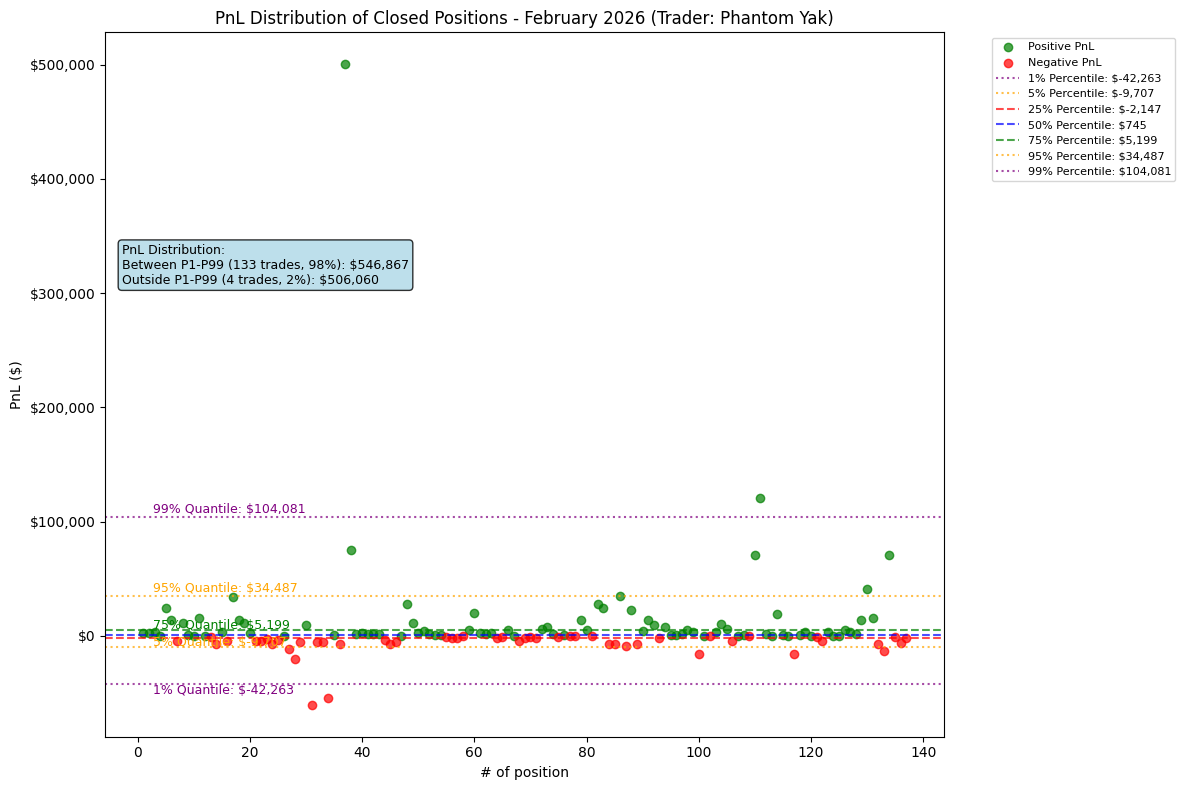
Phantom Yak's PnL distribution shows a clearly positive-skewed profile. The 75th percentile reached +$5.2k versus -$2.1k at the 25th, a roughly 2.4x ratio. The median trade was slightly positive (+$745), indicating that more than half of all positions contributed to the bottom line. Approximately 52% of his profits ($547K) came from the 133 trades within the P1–P99 range, while four outlier trades (2% of total) contributed the remaining $506K, nearly half the total. This indicates that while the majority of positions were modestly profitable, a few outsized winners were critical to overall performance.
Trader Spotlight: Cool Russell#
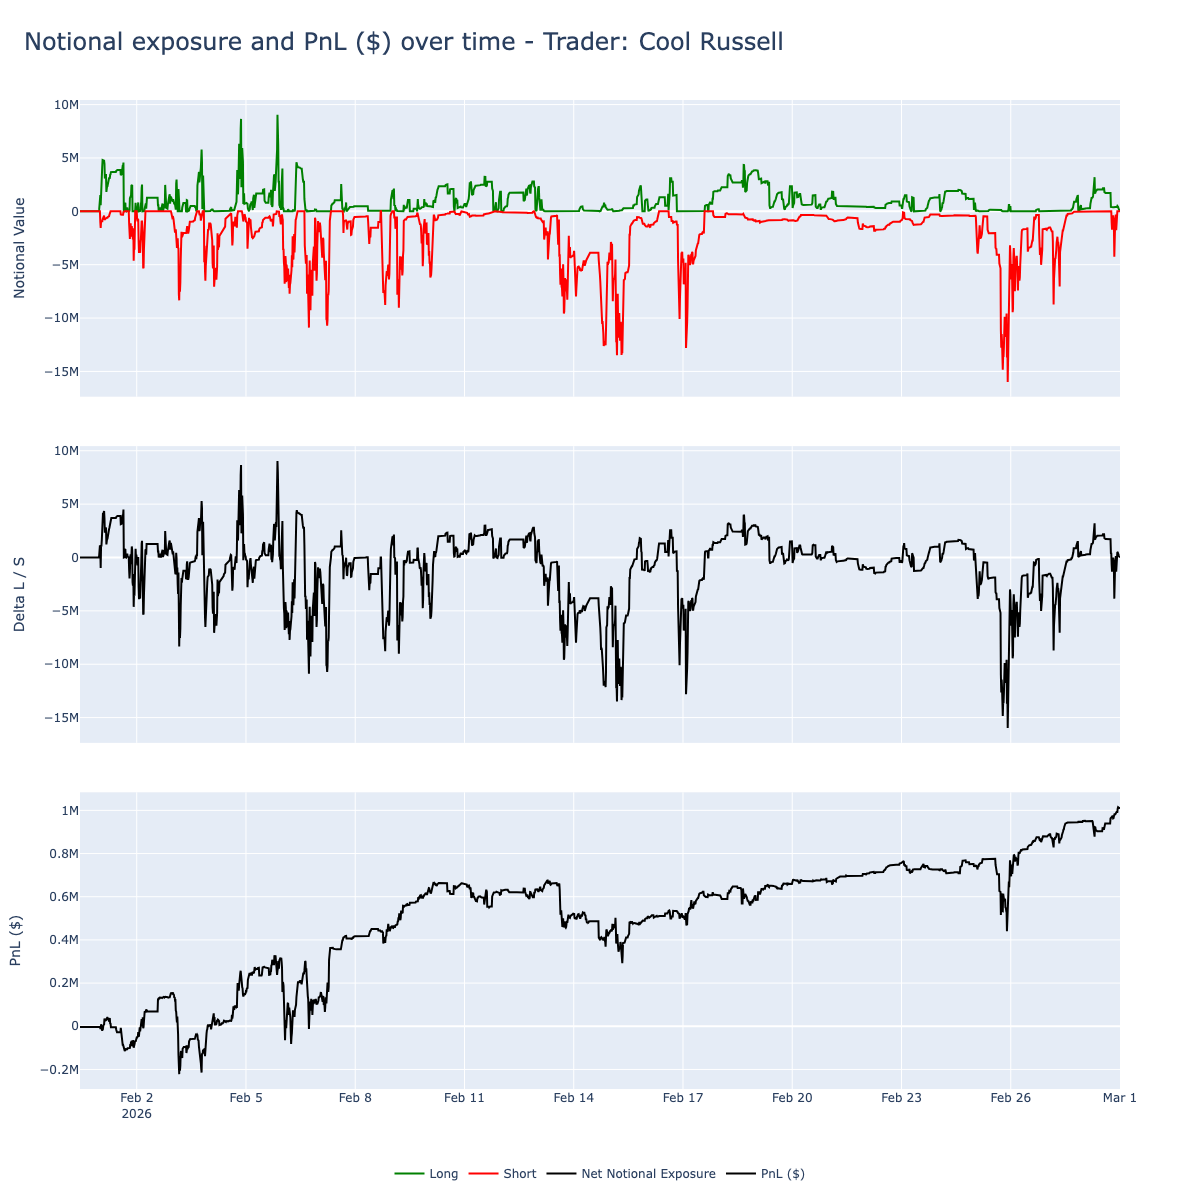
Cool Russell maintained simultaneous long and short positions throughout the month, with short exposure frequently reaching -$5M to -$15M and long positions generally staying within +$5M. Net exposure was predominantly short, oscillating between -$5M and -$15M for most of February, with occasional excursions toward neutral.
His PnL curve began with a brief dip below zero around Feb 2, but from there it increased in a fairly consistent manner, showing consistent accumulation from approximately $0 to $1M. By month end, he closed at approximately $1.01M in realized profits.
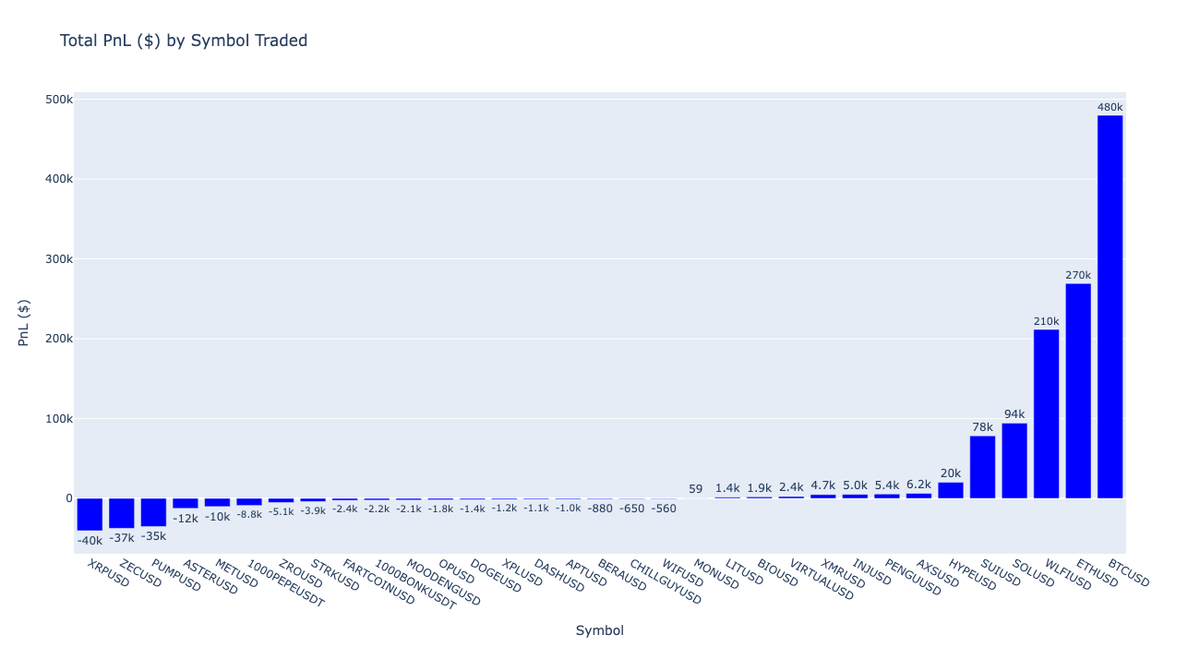
He traded a large set of symbols, closing positions across roughly 30 names. His activity spanned majors (BTC, ETH, SOL), perp DEX tokens (ASTER, PUMP), DeFi names (HYPE, $WLFI, XMR), memecoins (FARTCOIN, CHILLGUY, MOODENG, WIF), and L1s (SUI, INJ).
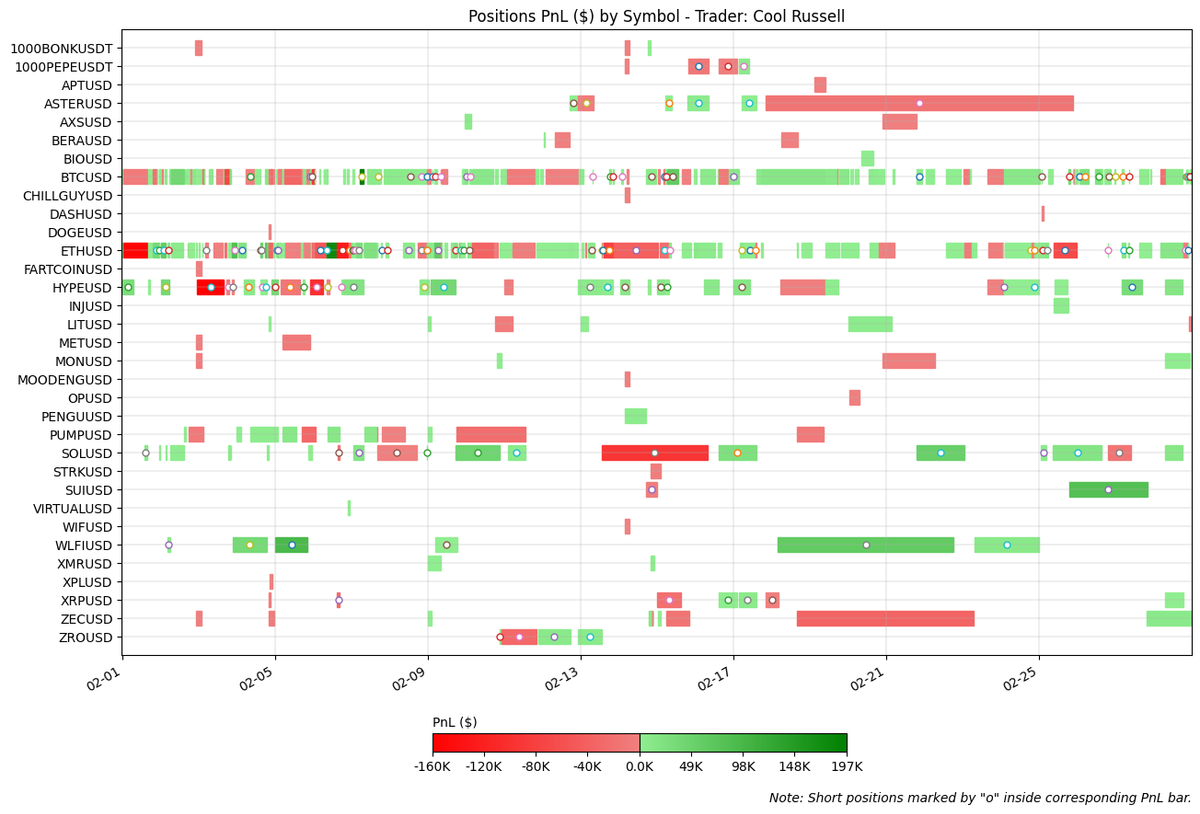
BTC (+$480K), ETH (+$270K), and WLFI (+$210K) led the results, totaling approximately $960K. The losing side was more distributed, with XRP (-$40K), ZEC (-$37K), and PUMP (-$35K) being the three worst-performing symbols, totaling about $112K in combined losses. The ratio between the top-three gains and top-three losses was roughly 8.6x, indicating that his winners far outweighed his losers at the symbol level despite the lower profit factor at the position level.
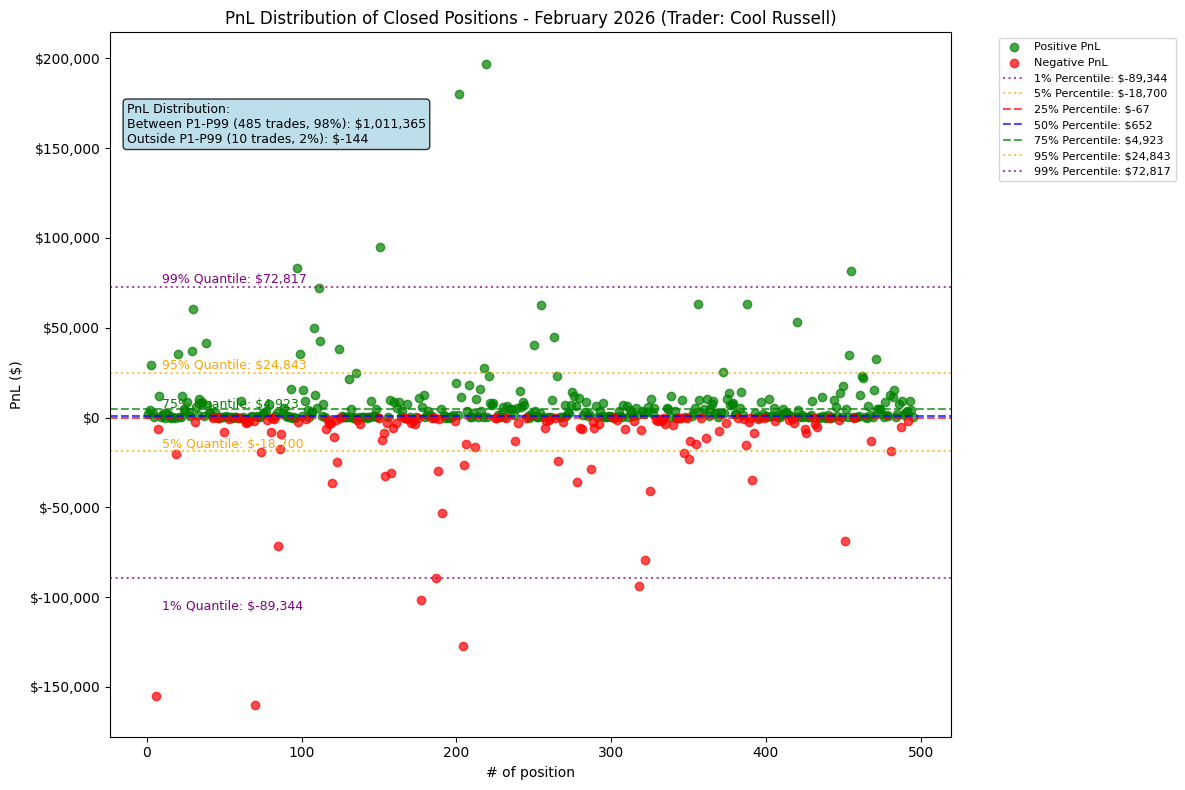
Cool Russell showed a relatively balanced distribution at the extremes: his 1st percentile (-$89.3k) and 99th percentile (+$72.8k) differ by only about 1.2x, meaning his largest winners were not dramatically larger than his largest losses. However, the mid-range tells a different story. The middle 50% of trades fell between -$67 and +$4,923, with a median of +$652, reflecting a positive skew at the core of his distribution. Virtually all of his $1.01M in profits came from the 485 trades within P1–P99, while the 10 outlier trades netted just -$144.
Trader Spotlight: NEET (Vault)#
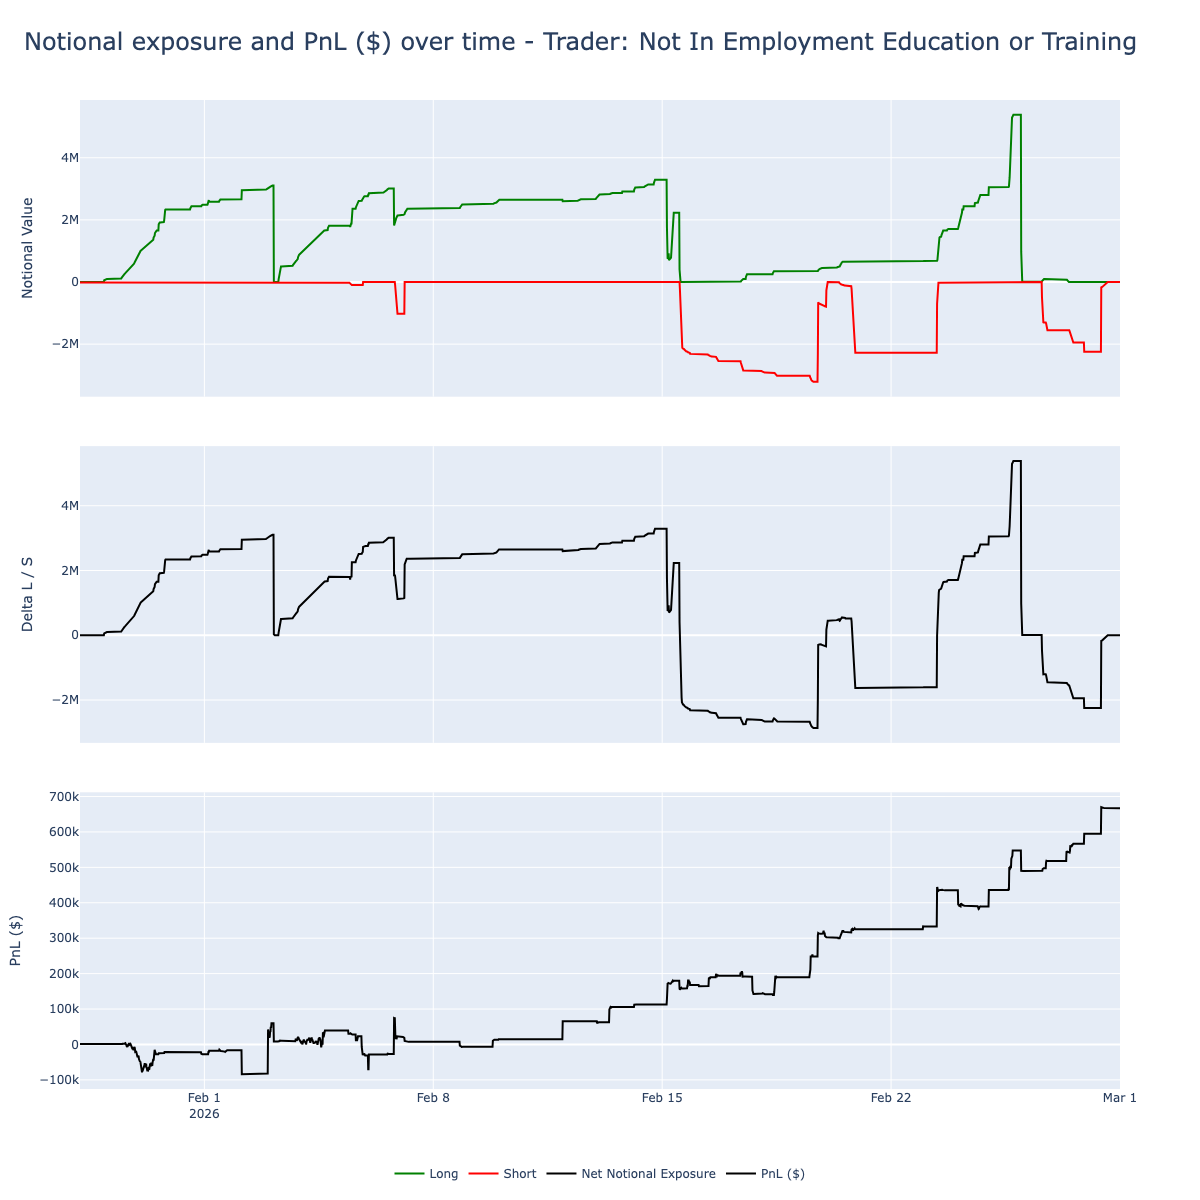
NEET was predominantly long-biased throughout February. He began building long exposure from approximately $1M to $3M during the first two weeks, with negligible short exposure. His PnL stayed near flat, and briefly negative, during the first week, before beginning to increase around Feb 8. Around Feb 15, he introduced short exposure (reaching roughly -$3M), briefly flipping net exposure to about -$3M. From Feb 20 onward, he returned decisively to the long side, building exposure up to +$5M. His PnL accelerated sharply in the last 10 days, moving from approximately $200K to $650K by month end, with the majority of profits generated in the final days.
NEET traded the most diverse universe, closing positions across 50 symbols. He held significant long-duration positions during the first half of the month, mainly on the long side. His second-half activity shifted to more frequent, shorter-duration positions across a wide range of mid-cap and alt names.
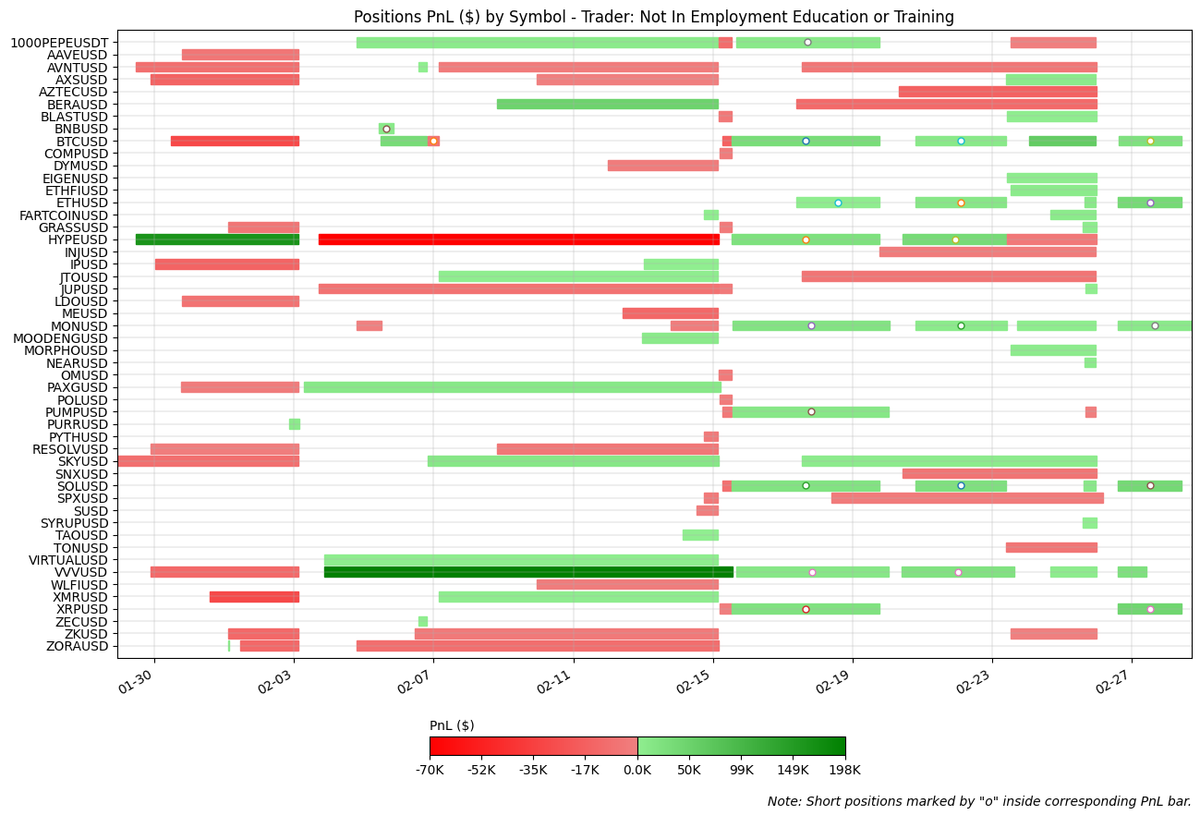
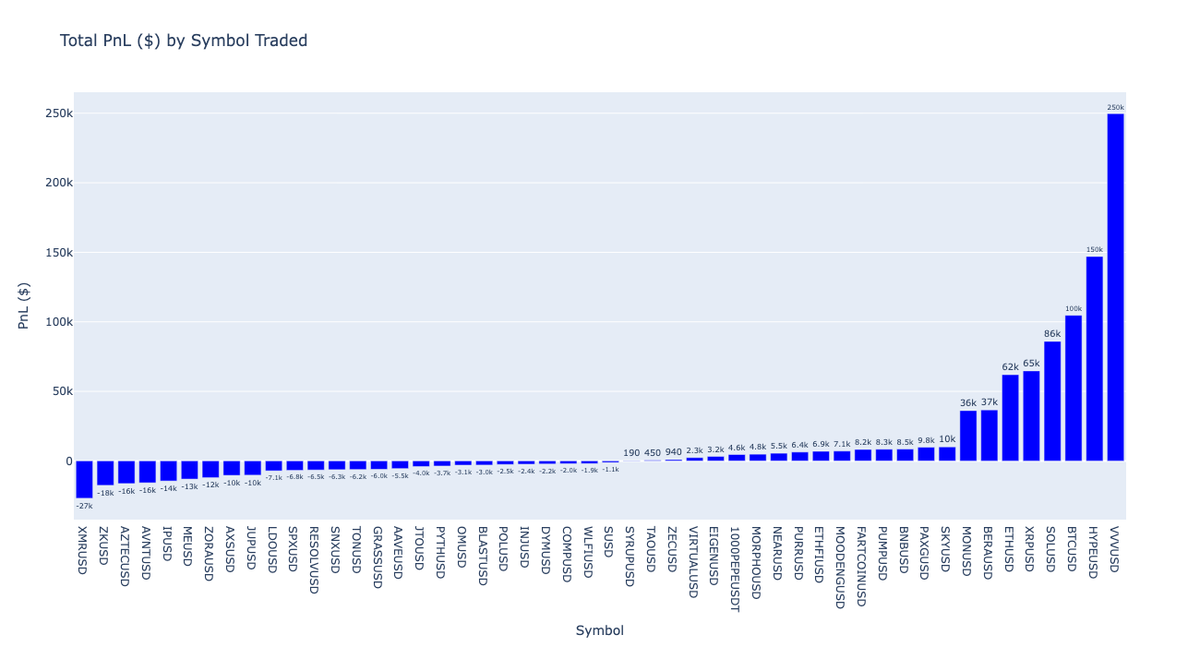
$VVV was the dominant contributor at +$250K, representing about 37% of his total monthly PnL. HYPE (+$150K), BTC (+$100K), SOL (+$86K), and ETH (+$65K) rounded out the top five, which together totaled approximately $651K. On the losing side, XMR (-$27K) was the largest negative, followed by ZK (-$18K) and AZTEC (-$16K). His profits were more evenly distributed across a long tail of symbols compared to the other two.
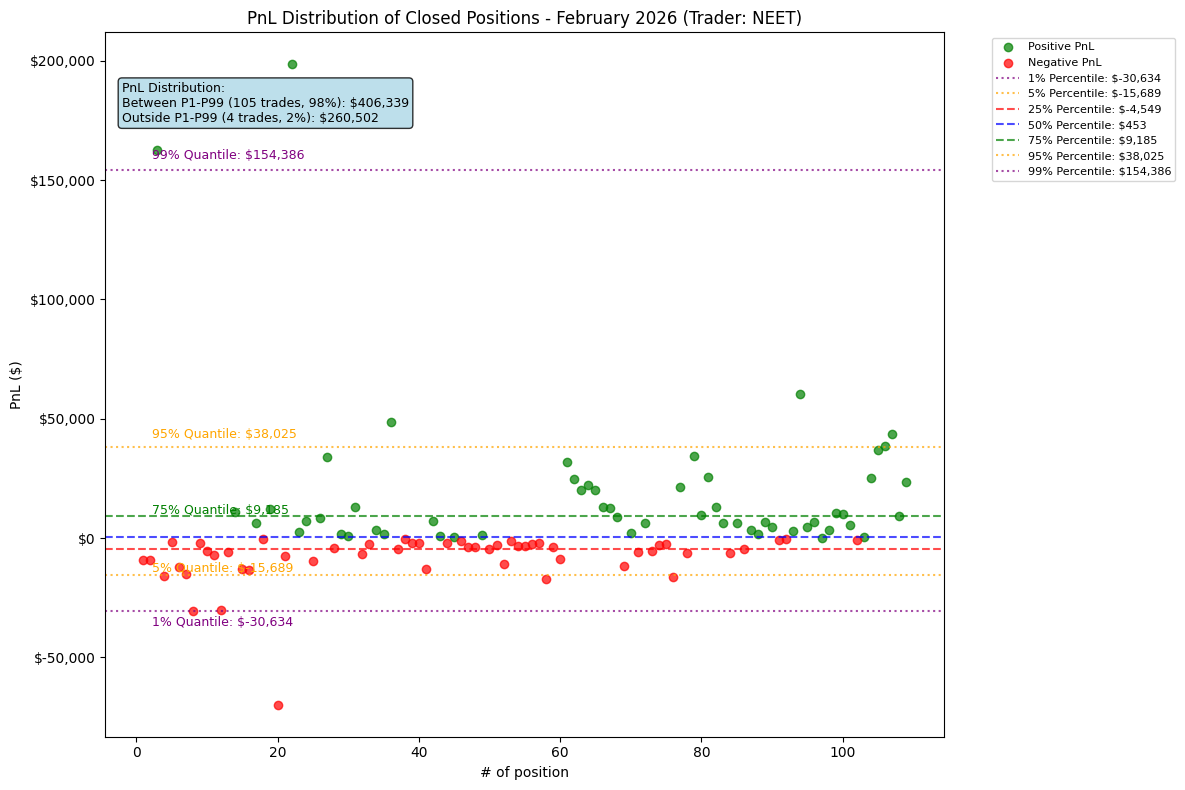
NEET's distribution shows the strong positive skew typical of the best traders featured in this report. The 105 trades within P1–P99 (98%) contributed $406K, while just 4 trades (2%) outside this range added $261K, approximately 39% of total profits from 2% of positions. His 75th percentile (+$9.2k) was about twice the magnitude of the 25th percentile (-$4.5k). The median trade was slightly positive (+$453), confirming that more than half of his positions were profitable.
Case Study - Trading the Venice AI ($VVV) Narrative#
In last month’s report we examined NEET’s overall positioning patterns. In February, however, one trade accounted for the majority of returns: a long position on VVV, the token of Venice AI. This trade was the single largest contributor to his monthly performance and illustrates how narrative-driven positioning can translate into outsized returns.
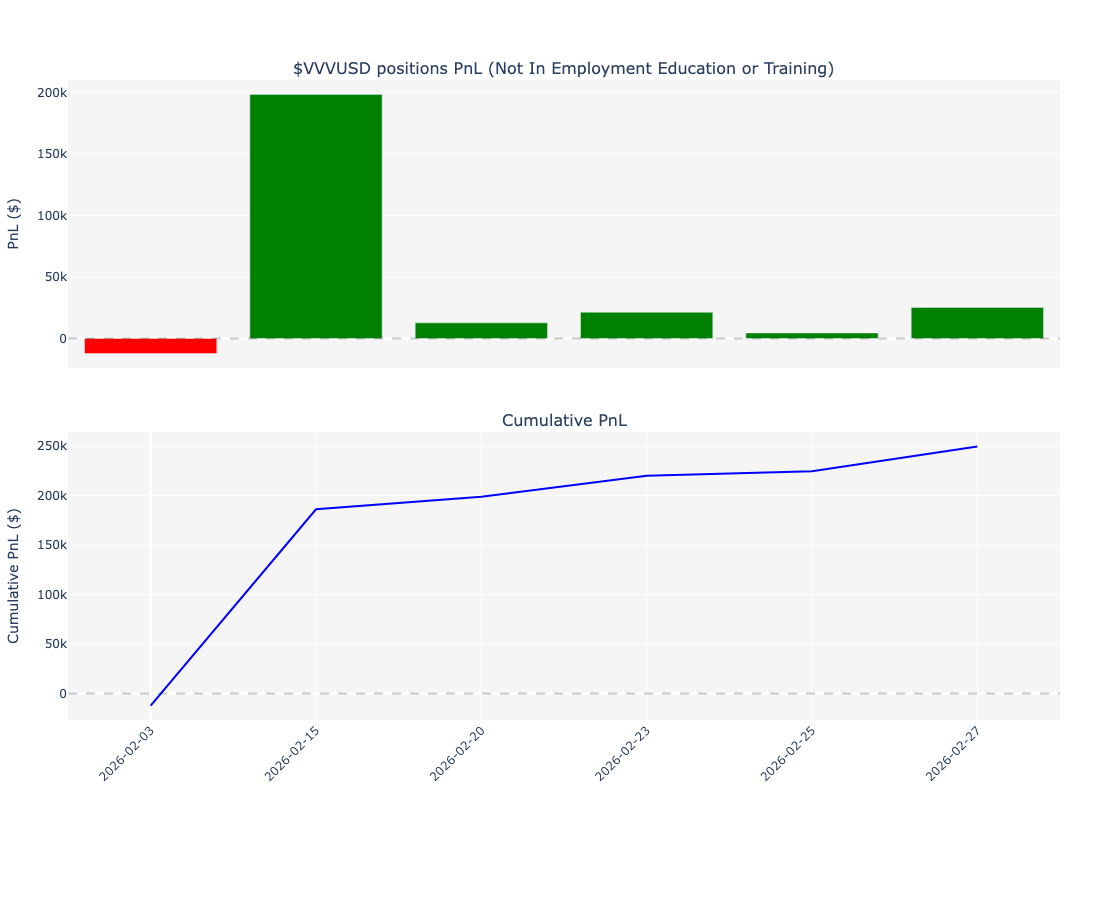
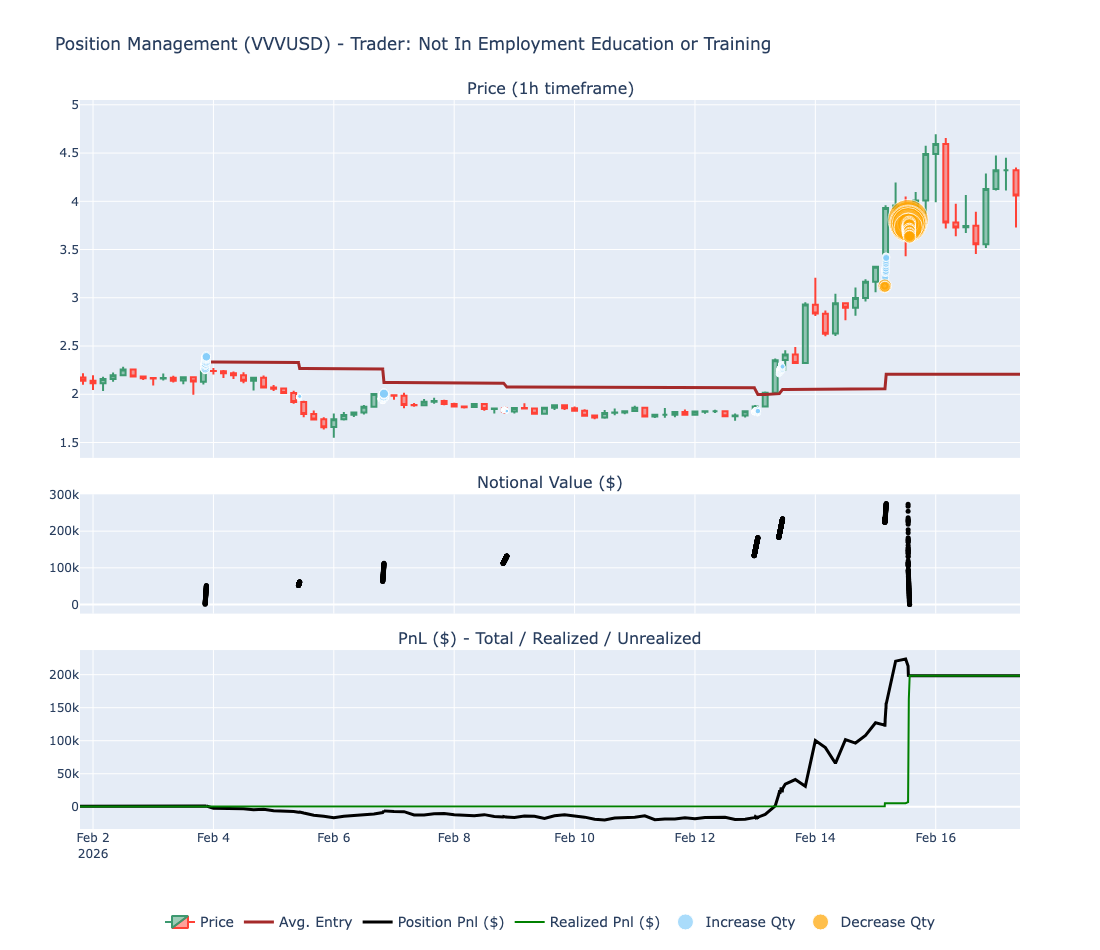
Across the month, VVV was NEET’s most profitable symbol, generating approximately $250K in realized profit across six trades (four longs and two shorts). The most notable of these was a long position initiated on February 3, which ultimately produced $198K in profit with a 72% ROI.
The timing of the position coincided with a sequence of fundamental developments around Venice AI. On February 3, Venice announced that the platform had surpassed 2M registered users, highlighting accelerating adoption of its AI infrastructure. The following day, the team announced integration with OpenClaw, an AI personal assistant that had recently gained significant attention in the ecosystem. Later in the month, on February 13, it also announced a reduction in token emissions to 6M tokens per year, introducing a supply-side catalyst.
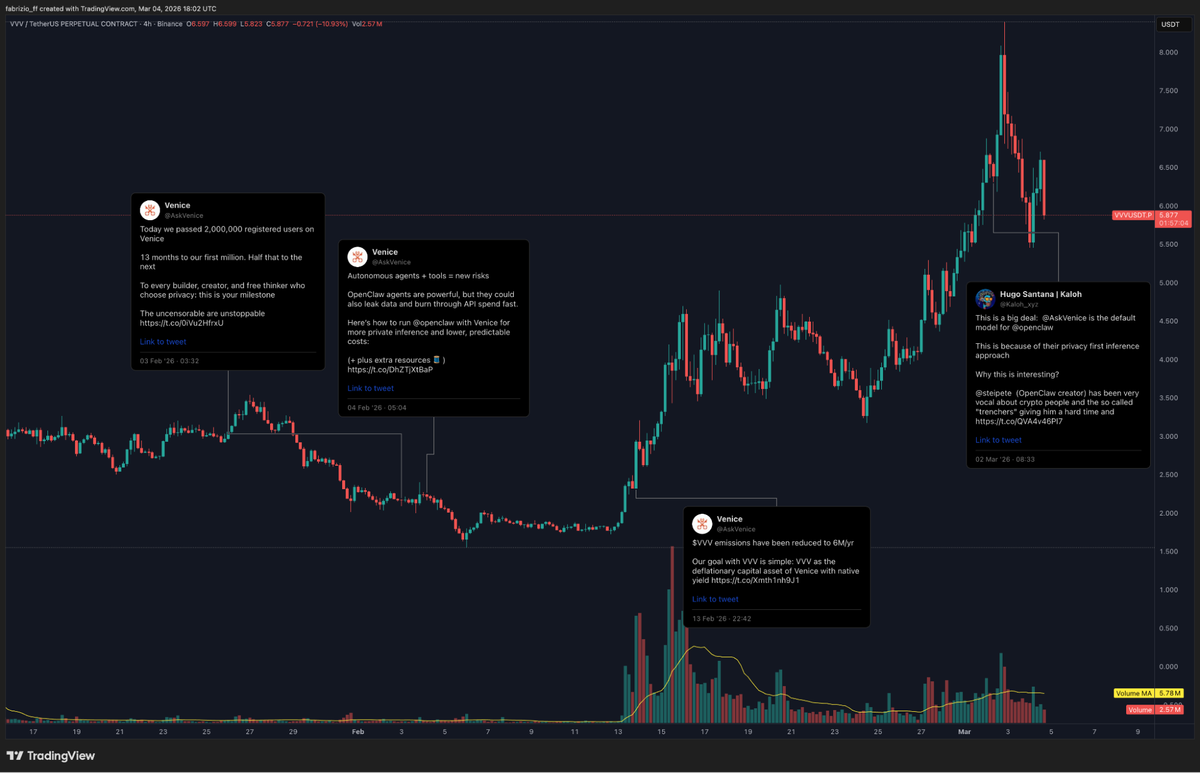
As shown in the chart below, NEET began accumulating the long position on February 3 with less than $100K in notional exposure. Over the following days he gradually increased the position size, continuing to add even as price temporarily moved below his initial entry. This averaging behavior suggests conviction in the underlying narrative.
Following the emissions announcement on February 13, NEET significantly increased his exposure, expanding the position to nearly $275K notional. The market reaction soon followed. As attention around the Venice AI ecosystem grew, the price of VVV rallied rapidly from approximately $2 to nearly $4 within two days.
NEET began reducing the position aggressively into this strength, fully exiting around February 15. The trade closed with approximately $198K in realized profit, representing a 72% return on the position.
Although NEET had other positions open during this period, this trade accounted for the largest share of his gains in February. More importantly, it illustrates how he was able to identify an emerging narrative early, building exposure before widespread market attention, and maintaining conviction long enough for the thesis to play out.
In this case, the thesis developed over roughly ten days of accumulation followed by two days of rapid price expansion.
Conclusion#
February was a difficult month for majors, but the top traders still delivered strong results. Phantom Yak led with $1.05M in profit and the highest profit factor, Cool Russell followed with $1.01M driven by high activity and a high win rate, and NEET closed at $667K with the strongest profit-to-drawdown profile. The VVV case study also highlights how a single well-timed position can account for a meaningful share of monthly performance.
Follow our highlight traders on Twitter:
- Phantom Yak: please if you know, let us know his twitter handle
- Cool Russell: please if you know, let us know his twitter handle
- NEET: https://x.com/theneetguy
Join Mirrorly: https://portal.mirrorly.xyz/
Subscribe to our Notifications so you don't miss next month's report!