"Different edges, same outcome: positive PnL."
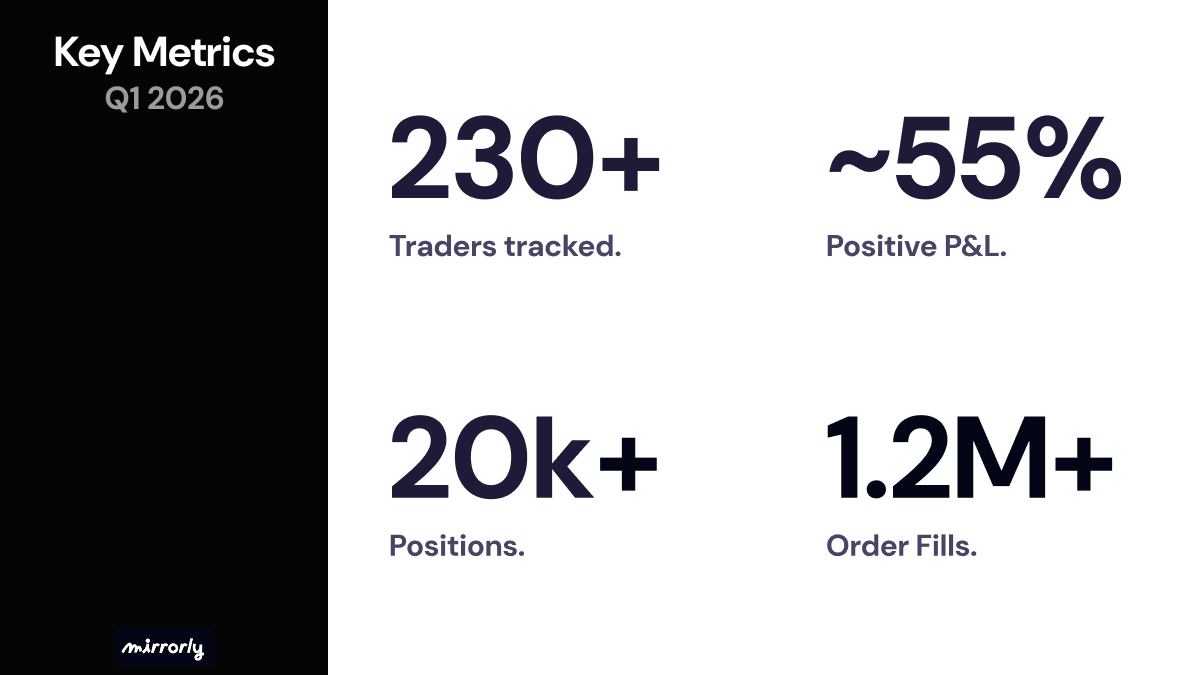
In Q1 2026, Mirrorly tracked over 230 traders across Hyperliquid and Binance Smart Money, following the sunset of the Binance Leaderboard earlier this year.
With BTC down 25% and most majors in deep drawdown, approximately 55% of them still finished the quarter profitable. Over the period, the platform tracked more than 20k closed positions and over 1.2 million individual order fills.
Market Overview#
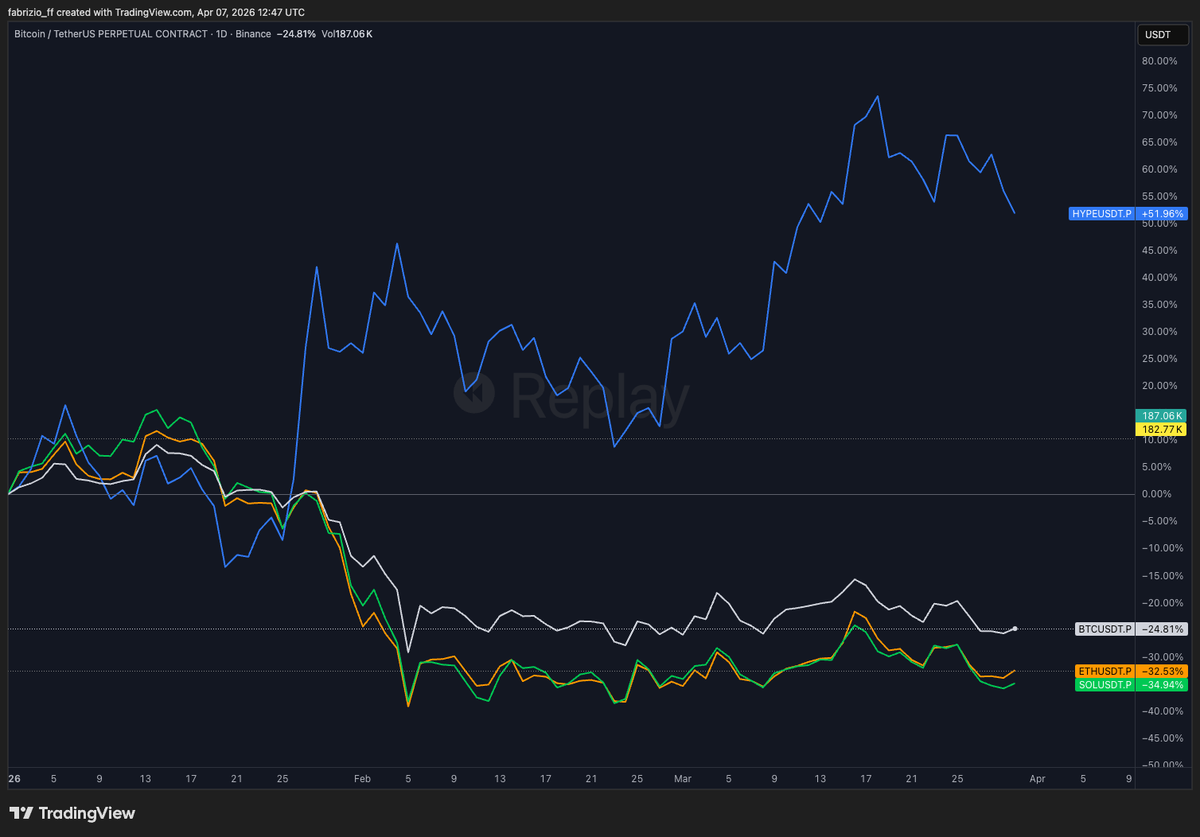
Q1 2026 was one of the most difficult quarters for crypto markets in recent memory, with broad and sustained drawdowns across all majors. The quarter began with a brief continuation of December's recovery, but selling pressure resumed in late January and intensified through February and March.
$BTC finished Q1 down roughly 25%, making it the most resilient of the majors but still deep in drawdown territory. $ETH fared worse, closing the quarter down approximately 33%, while $SOL was the weakest of the large-cap group at around -35%.
The one clear outlier was $HYPE, which defied the broader trend and closed Q1 up approximately 52%, driven by a sustained rally through February and March that took it from near flat to over 75% before pulling back into quarter end.
Broad beta exposure to majors was punished, while traders who identified relative-strength names or actively managed their directional exposure had significantly more room to operate. The rest of this report focuses on the ten traders with the highest realized PnL on the Mirrorly leaderboard during Q1 2026, based on all traders tracked over the period.
Top Performers of the Quarter#
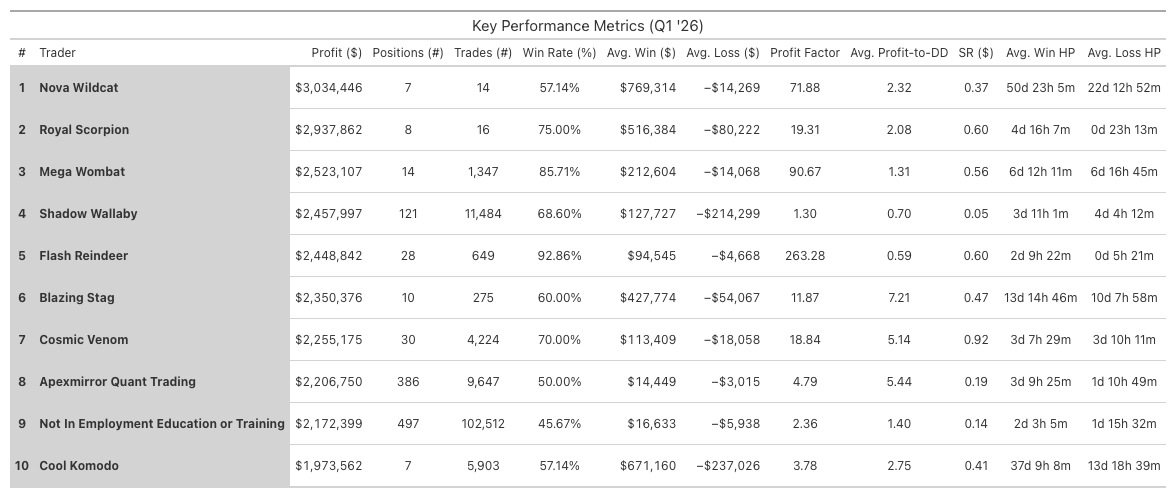
With $BTC, $ETH, and $SOL all finishing the quarter in double-digit drawdowns, the top ten Mirrorly traders of Q1 recorded profits ranging from $2.0 million to $3.0 million, with the top three alone generating more than $8.5 million in realized PnL.

Nova Wildcat led the group with $3.0M across just 7 positions, posting a 57.1% win rate and a very high 71.8 profit factor. Royal Scorpion followed with $2.9M from 8 positions, combining a 75% win rate with a 19.3 profit factor. In third place, Mega Wombat produced $2.5M across 14 positions, supported by an 85.7% win rate and a 90.7 profit factor.
Across the full top-10 cohort, performance metrics varied widely. Among traders with at least ten closed positions, profit factors ranged from 1.30 to 263, and win rates from 45.67% to 92.86%. The same dispersion appears in holding periods and trading intensity. Average winning trade duration ranged from just 2 days (Flash Reindeer) to over 50 days (Nova Wildcat), showing that similar PnL outcomes were achieved using very different trade horizons and turnover rates.
At one extreme, Nova Wildcat and Cool Komodo closed only 7 positions each during the entire quarter, yet both generated over $1.97M. Nova Wildcat's average winner was $769K with an average holding period of over 50 days, making it the most concentrated, longest-duration performance in the group. Royal Scorpion followed a similar low-frequency approach with 8 positions and average winners of $516K.
At the other extreme were the high-volume traders. Not In Employment Education or Training closed 497 positions with a 45.67% win rate, producing $2.17M through repeated edges across over 102k trades. Shadow Wallaby also ran a high-activity book with 121 positions and 11.5k trades, finishing with $2.46M despite a relatively low profit factor of 1.30.
Further down the top ten, Apexmirror Quant Trading ended Q1 with $2.2M across 386 positions and a 50% win rate, relying on a favorable average win ($14.4K) to average loss ($3.0K) ratio of roughly 4.8 to 1. Blazing Stag produced $2.4M from just 10 positions with the highest average profit-to-drawdown ratio in the group at 7.21, indicating strong risk-adjusted performance relative to the heat taken while positions were open.
Taken together, the Q1 leaderboard shows that top-tier profitability was achieved through very different combinations of win rate, trade frequency, and holding period, even during one of the most difficult quarters in recent memory.
For Mirrorly copytraders, this dispersion makes it critical to understand how each trader generates returns and to diversify across complementary profiles.
Where the Capital Was Deployed#
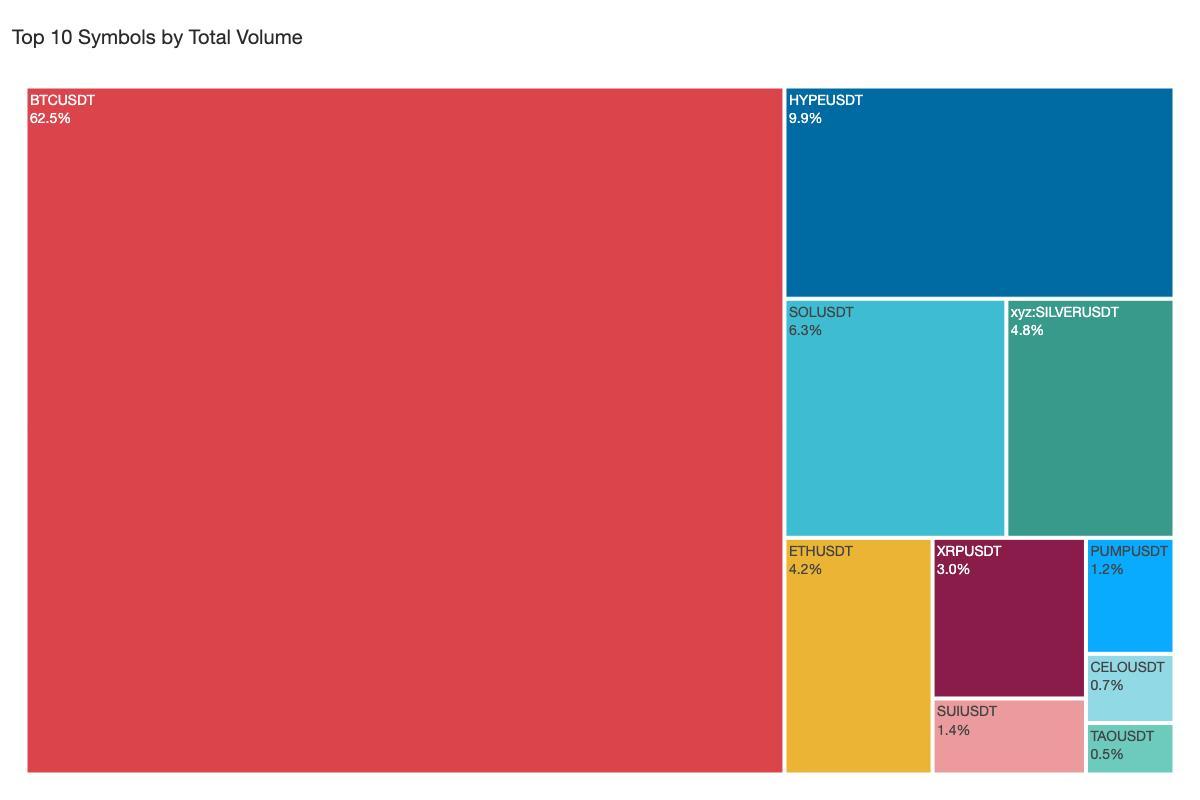
Trading activity in Q1 was overwhelmingly concentrated in a single market. $BTC (62.5%) alone accounted for nearly two-thirds of total traded notional, far more concentrated than Q4 2025, when $ETH and $BTC were more evenly split. $HYPE (9.9%) was the second-largest market by volume, reflecting strong interest in the quarter's best-performing asset. $SOL (6.3%) and xyz:SILVER (4.8%) rounded out the next tier, while $ETH (4.2%) saw a strong decline in volume share compared to previous quarters.
Beyond these, $XRP (3.0%), $SUI (1.4%), $PUMP (1.2%), $CELO (0.7%), and $TAO (0.5%) made up the remainder of the top ten.
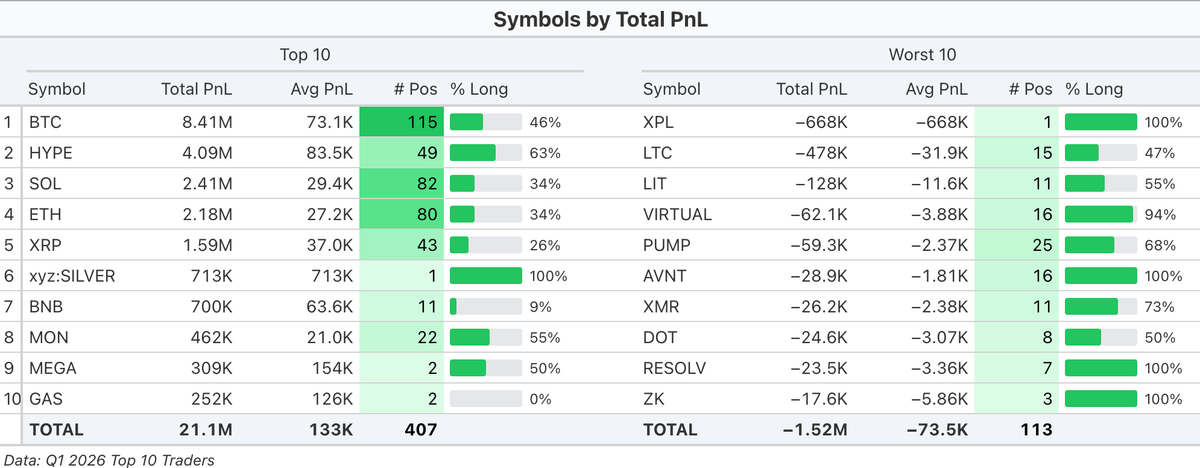
The table below breaks down how PnL was distributed across individual symbols. On the profitable side, $BTC was the dominant contributor, generating $8.4M across 115 positions, far ahead of $HYPE ($4.1M) and $SOL ($2.4M). Together, the top four symbols ($BTC, $HYPE, $SOL, and $ETH) accounted for $17.1M, or roughly 81% of all positive PnL in the group.
An interesting feature of Q1 is the directional skew across these top performers. $BTC positions were nearly balanced at 46% long, suggesting traders profited from both sides of the move. $HYPE was 63% long, consistent with its strong uptrend. Meanwhile, $SOL (34% long), $ETH (34% long), and $XRP (26% long) were heavily short-biased, likely confirming that the top traders were actively positioned for downside in the weakest assets.
On the losing side, losses were concentrated in far fewer positions. The bottom-10 symbols together lost $1.52M across just 113 positions, led by $XPL (-$668K on a single position) and $LTC (-$478K across 15 positions), which together accounted for over 75% of total losses.
How Returns Were Generated#
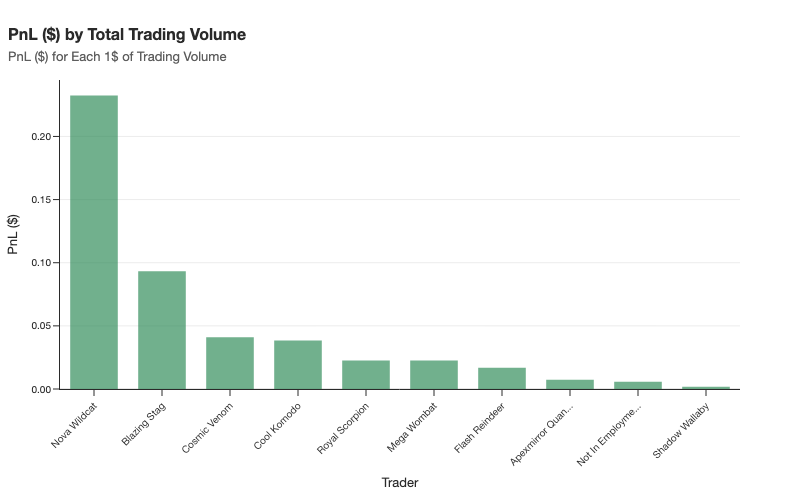
When measured by profit per unit of exposure, the most capital-efficient trader by far was Nova Wildcat, earning roughly $0.23 per $1 of volume. This is an exceptionally high figure, more than double the next trader and consistent with his extremely concentrated, long-duration approach of just 7 positions over the entire quarter.
Blazing Stag followed at approximately $0.095 per $1. Cosmic Venom and Cool Komodo clustered around $0.04 per $1, while Royal Scorpion and Mega Wombat sat in the $0.02 to $0.025 range. At the bottom of the efficiency spectrum, Shadow Wallaby registered close to $0.001 per $1, the lowest in the group, reflecting high turnover relative to realized gains.
For Mirrorly users, these differences matter. A higher PnL-per-Volume ratio does not automatically imply a better or worse trader, as participants reach similar PnL outcomes using very different levels of turnover and exposure.
However, lower ratios leave less margin for execution costs and slippage, since a larger share of gross returns is consumed by fees.
Conclusion#
Q1 2026 was a quarter defined by broad market weakness. With $BTC down 25%, $ETH down 33%, and $SOL down 35%, the environment was very challenging. Yet 55% of Mirrorly's tracked traders still finished in profit, and the top ten generated between $2.0M and $3.0M each.
The leaderboard reveals that profitable trading was achieved through fundamentally different approaches. Concentrated, long-duration swing traders (Nova Wildcat, Royal Scorpion, Cool Komodo) coexisted with high-frequency, high-volume ones (Not In Employment Education or Training, Shadow Wallaby).
For Mirrorly users, understanding how each trader generates returns remains as important as the returns themselves.
—
Want to track and copy the best traders on Binance and Hyperliquid?
Join Mirrorly to access real-time insights from top leaderboard accounts and follow their moves with precision.
👉 [Join Here](https://portal.mirrorly.xyz/)
We track a carefully curated and regularly updated list of top-performing public traders across platforms like Binance and Hyperliquid. While we aim for high data accuracy, some limitations remain, such as traders switching to private mode or technical constraints like rate limits. Despite these challenges, we dedicate significant effort to ensure the data is as reliable as possible.