“Different edges, same outcome: positive PnL.”
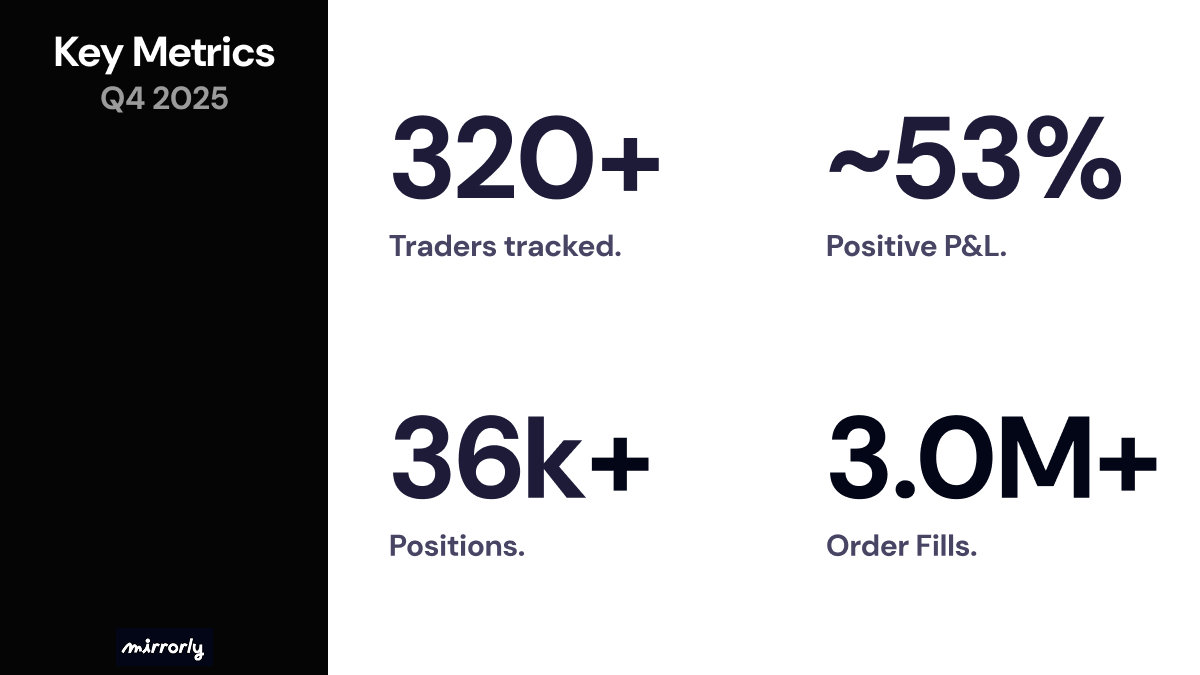
In Q4 2025, Mirrorly’s curated trader universe expanded from 265 to more than 320 tracked traders. Over the quarter, approximately 53% of them were profitable, lower than in the previous quarter, but still elevated given the market environment. During this period, the platform recorded more than 36k closed positions and over 3.0 million individual order fills.
Market Overview#
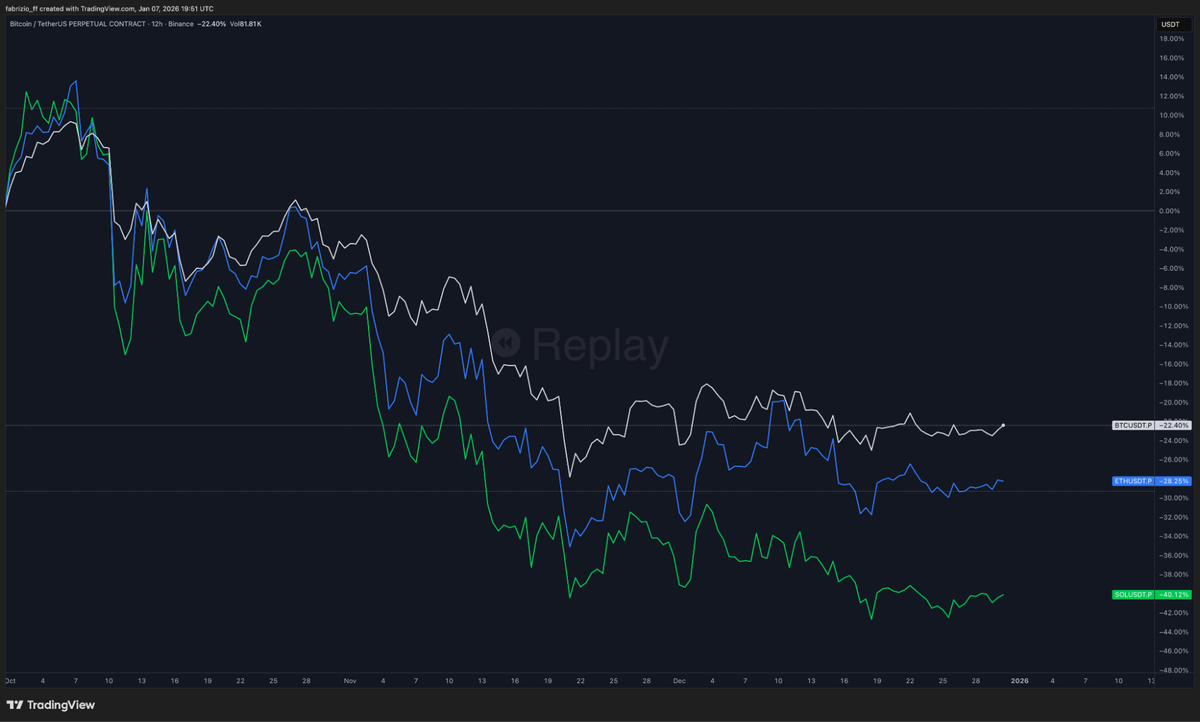
Q4 2025 was a broadly negative quarter for crypto markets, with all major assets entering a sustained drawdown. The quarter started with a brief continuation of September’s strength, but momentum faded quickly and selling pressure accelerated into mid-October. By early November, the downtrend was firmly established across the board.
From that point onward, performance diverged but remained weak. $BTC proved the most resilient, finishing the quarterdown roughly22%, while $ETH underperformed at around-28%. $SOL saw the deepest drawdown, losing over 40%. After the November sell-off, markets entered a choppy, range-bound phase through December, with no meaningful recovery.
In this environment, the rest of the report focuses on the ten traders with the highest realized PnL on the Mirrorly leaderboard during Q4 2025, based on all traders tracked over the period.
Top Performers of the Quarter#
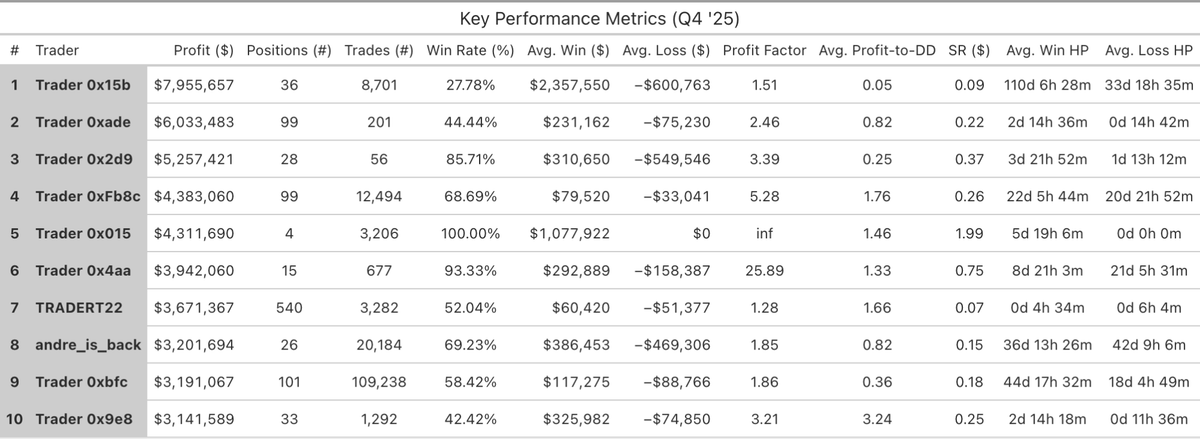
Despite operating in a broadly negative market environment, the top ten Mirrorly traders of Q4 recorded profits ranging from $3.1 million to $8.0 million, with the top three alone generating more than $19 million in realized PnL.
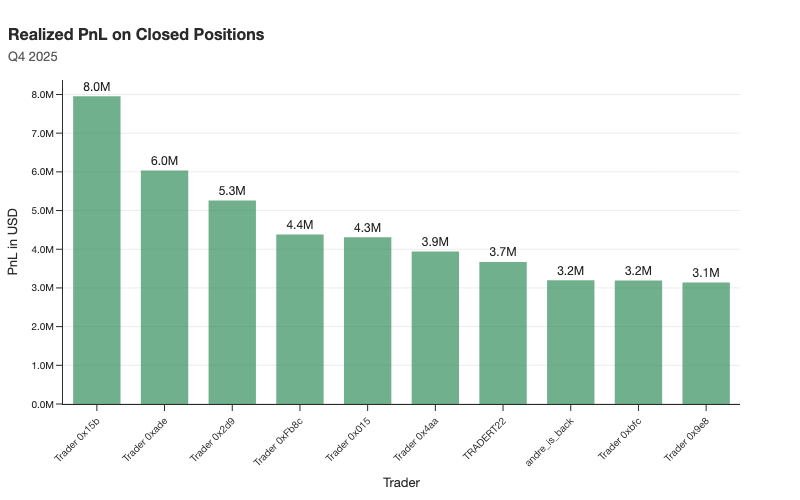
Trader 0x15b led the group with $7.96M across 36 positions, posting a 27.78% win rate and a 1.51 profit factor. Trader 0xade followed with $6.03M from 99 positions, combining a 44.44% win rate with a 2.46 profit factor. In third place, Trader 0x2d9 produced $5.26M across 28 positions, supported by an 85.71% win rate and a 3.39 profit factor.
Across the full top-10 cohort, performance metrics varied widely. Among traders with at least ten closed positions, profit factors ranged from 1.28 to 25.89, and win rates from 27.8% to over 93%. Trader 0x4aa was the clear outlier on efficiency, recording a 93.33% win rate across 15 positions and the highest profit factor (25.89), although with longer losing-trade holding periods than winners.
The same dispersion appears in holding periods and trading intensity. Average winning trade duration ranged from just 4 hours (TRADERT22) to over 110 days (Trader 0x15b), showing that similar PnL outcomes were achieved using very different trade horizons and turnover.
At one extreme, Trader 0x015 closed only four positions during the entire quarter, won all of them, and generated $4.31M, making it the most concentrated performance in the group. Trader 0x4aa followed a similar pattern with 15 high-accuracy positions, ranking among the top earners despite minimal trade count.
At the other extreme were the high-volume ones. TRADERT22 closed 540 positions with a 52.04% win rate, producing $3.67M through repeated small edges. Trader 0xbfc went even further, executing over 109k trades across 101 positions while still finishing the quarter with $3.19M in realized profit.
Rounding out the leaderboard, Trader 0x9e8 ended Q4 with $3.14M across 33 positions. The name is notable: the same trader closed 2025 with $12M in realized PnL and eight profitable months, and once again delivered positive performance during a difficult quarter.
Taken together, the Q4 leaderboard shows that top-tier profitability was achieved through very different combinations of win rate, trade frequency, and holding period. For Mirrorly Copytraders, this dispersion makes it critical to understand how each trader generates returns and to diversify across complementary profiles, rather than concentrating exposure in a single execution style.
Where the Capital Was Deployed#
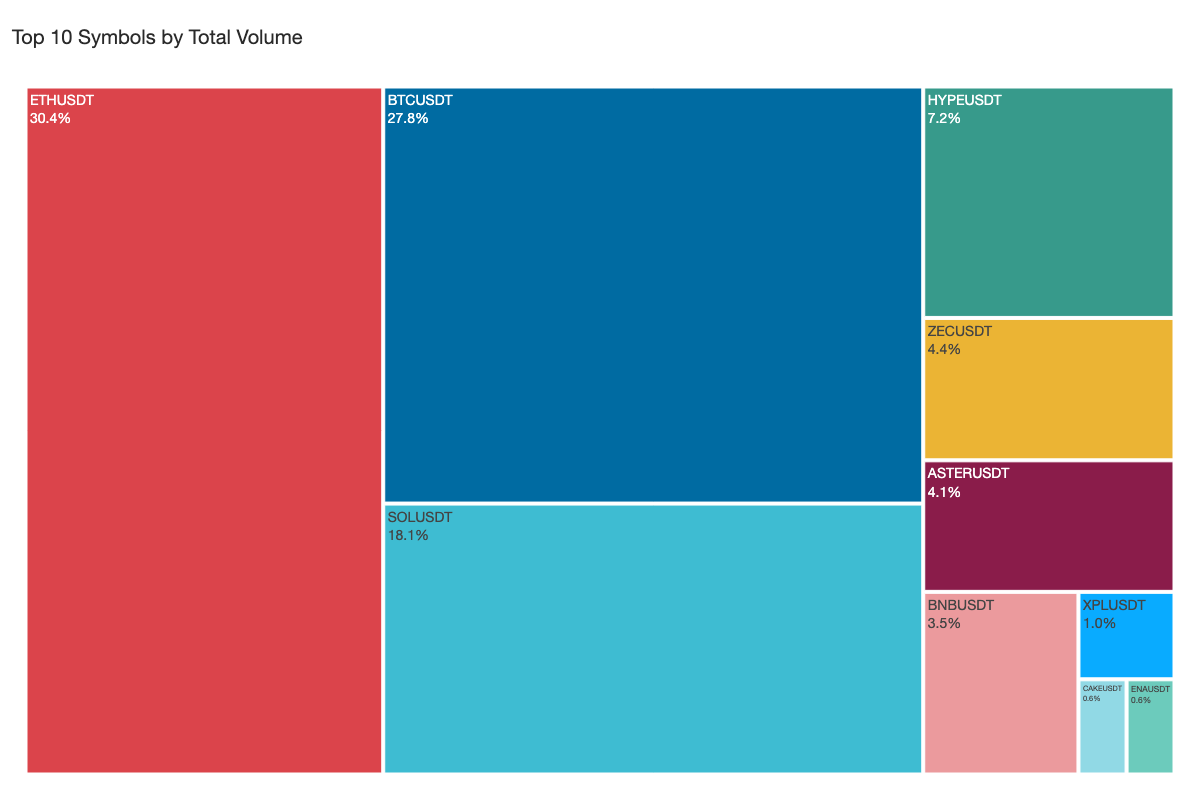
Trading activity in Q4 was highly concentrated in a small number of large-cap markets. $ETH (30.4%) and $BTC (27.8%) alone accounted for over 58% of total traded notional, while $SOL (18.1%) brought the combined share of the top three symbols to more than 76%. Beyond these, $HYPE (7.2%) was the only non-majors contract to exceed a 5% share, with the remaining volume spread thinly across a long tail of assets such as $ZEC, $ASTER, $BNB, and $XPL. Outside of the majors, this mix aligns with the dominant late-year themes, reflecting the market focus on privacy and DEX narratives.
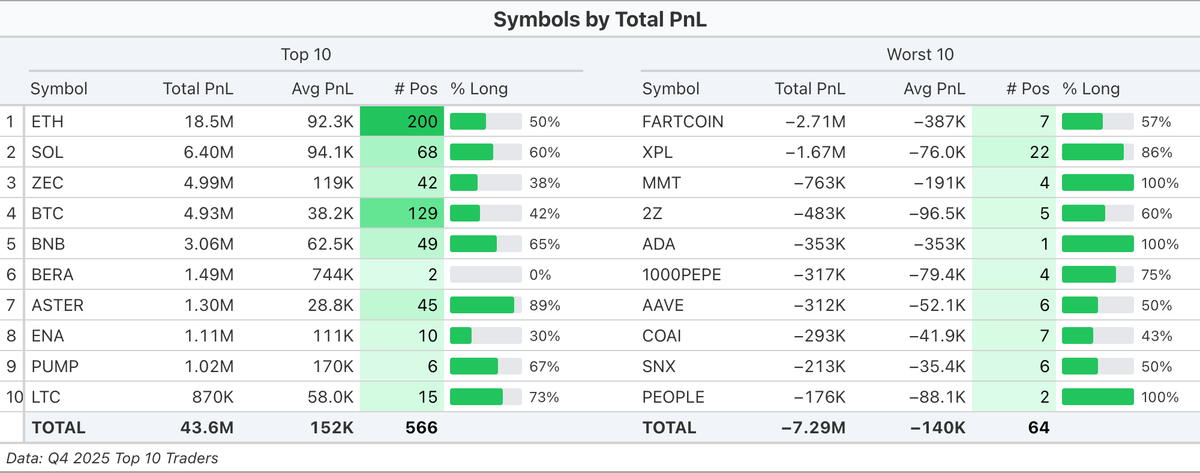
The below table breaks down how PnL was distributed across individual symbols. On the profitable side, $ETH was the dominant contributor, generating $18.5M across 200 positions, far ahead of $SOL ($6.4M) and $ZEC ($5.0M). Together, the top four symbols ($ETH, $SOL, $ZEC, and $BTC) accounted for nearly $35M, or roughly 80% of all positive PnL in the group.
On the downside, losses were much more concentrated. The bottom-10 symbols together lost $7.29M, led by $FARTCOIN (-$2.71M) and $XPL (-$1.67M), which together accounted for over half of total losses. Compared with the profitable side, losing symbols were traded in far fewer positions (64 vs. 566).
How Returns Were Generated#
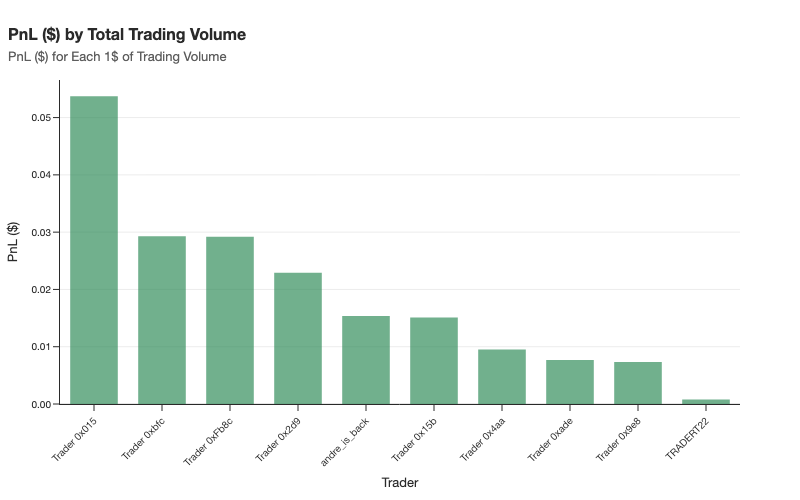
When measured by profit per unit of exposure, the most capital-efficient by traded volume traders were 0x015, 0xbfc and 0xFb8c, earning between $0.03 and $0.05 per $1 of volume. By comparison, Trader 0x15b and andre_is_back, despite strong absolute profits, generated around $0.015 per $1, while TRADERT22 sat at the bottom of the group at close to $0 per $1.
For Mirrorly copy-traders, these differences matter. A higher PnL-per-Volume ratio does not automatically imply a better or worse trader, as participants reach similar PnL outcomes using very different levels of turnover and exposure. However, lower ratios leave less margin for execution costs and slippage, since a larger share of gross returns is consumed by fees.
This is visible in TRADERT22’s case: despite ranking last on this efficiency metric, the trader has been consistently profitable across the year and featured in both Q1 and Q2 Mirrorly quarterly insights, showing that long-term profitability and capital efficiency are not the same dimension and should be evaluated separately when selecting traders to copy.
The PnL distribution further reveals that most traders averaged around breakeven per position, with Trader 0x015 showing the most positively skewed profile, clustering around $1M per win with zero on the downside. Conversely, Trader 0x15b displayed the widest range, with wins reaching $13.2M but losses dipping to almost -$3M.
Conclusion#
Despite a difficult market, the Q4 leaderboard shows that profitable trading can be achieved through very different approaches. For Mirrorly users, understanding how each trader generates returns is as important as the returns themselves when building a resilient copytrading portfolio.
**Want to track and copy the best traders on Binance and Hyperliquid?
**Join Mirrorly to access real-time insights from top leaderboard accounts and follow their moves with precision.
👉 Apply for Beta Access
Check out the blog for more insights: https://blog.mirrorly.xyz/
Disclaimer#
We track a carefully curated and regularly updated list of top-performing public traders across platforms like Binance and Hyperliquid. While we aim for high data accuracy, some limitations remain, such as traders switching to private mode or technical constraints like rate limits. Despite these challenges, we dedicate significant effort to ensure the data is as reliable as possible.