
Top Traders Report - September '26#
Introduction#
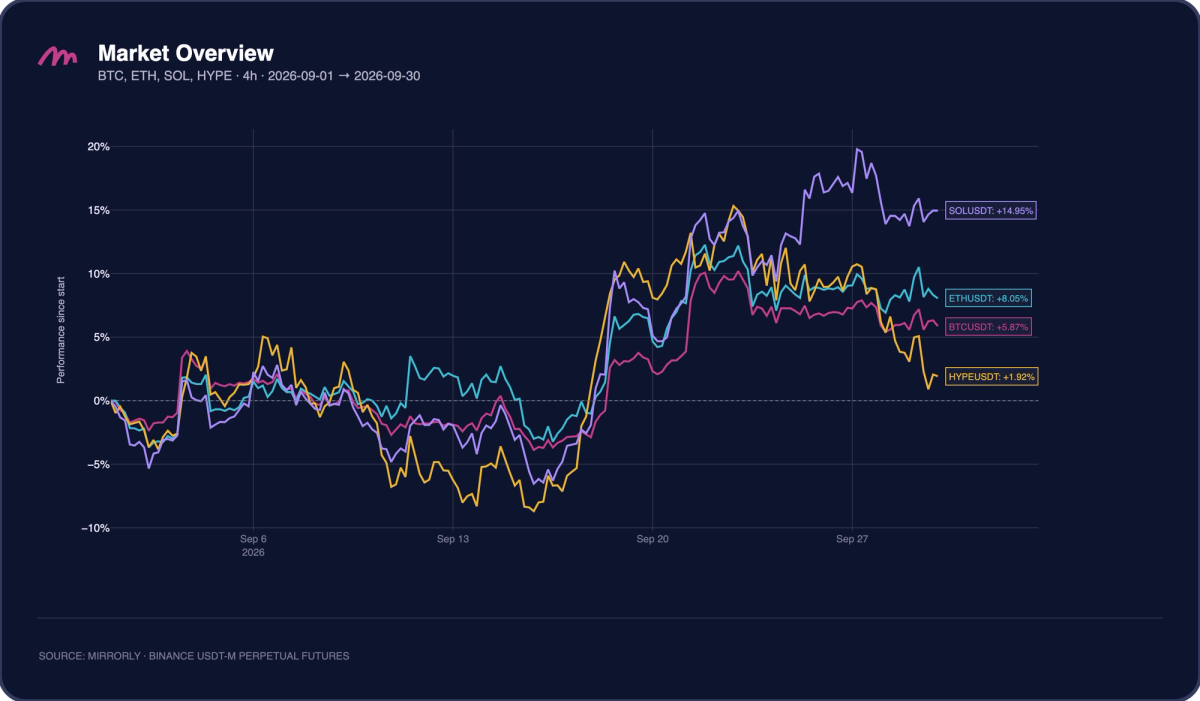
September opened with two weeks of chop and then resolved higher. Through the first half of the month the four benchmarks stayed within roughly five points of flat, fading into mid-month lows around September 15 and 16, where $HYPE sat near -9%, $SOL near -6%, and $BTC and $ETH around -3% to -4%. The turn came between September 17 and 19, when every major repriced higher, and by September 22 and 23 $SOL and $HYPE were both near +15%, $ETH around +12%, and $BTC close to +10%.
The final week split the group. $SOL touched roughly +20% on September 27 before closing up about +15.0%. $ETH and $BTC finished around +8.1% and +5.9%. $HYPE, the leader of the past months, sold off from September 23 and closed up only about +1.9%. Directional exposure paid in a narrow window in the third week, while the rest of the month favored traders who could work both sides or pick the right symbol.
This month Mirrorly’s top 3 traders are:
🏆 Shadow Wallaby (Hyperliquid): +$6.49M
🥈 Silent Viper (Hyperliquid): +$4.32M
🥉 Flash Reindeer (Hyperliquid): +$1.23M
Shadow Wallaby led September with $6.49M in profit across 62 closed positions and 16.6k trades. This is his third month in a row at the top of the leaderboard, his sixth appearance in the last seven monthly reports, and his largest monthly result of the year. The profile is unchanged: a 71.0% win rate with an average win of $257.4K against an average loss of $268.8K, so the hit rate rather than the payoff ratio produced the profit factor of 2.34. His average profit-to-drawdown ratio of 0.94 was again the lowest in the table, although improved from 0.51 in August. Winners were held about 3 days 11 hours and losers about 3 days 22 hours.
Silent Viper finished second with $4.32M across 15 closed positions and 887 trades, in his first monthly report after ranking second in the Q3 Quarterly Insight. He posted the highest win rate of the three at 73.3%, and his average win of $409.2K was roughly 9.2 times his average loss of $44.6K, producing the best profit factor (25.22) and the best average profit-to-drawdown ratio (7.78) in the table. Both winners and losers were held for about 28 days on average, roughly eight times longer than the other two traders.
Flash Reindeer, previously highlighted in the Q1 Quarterly Insight, generated $1.23M across only 9 closed positions, with 3,245 trades inside them pointing to heavy scaling in and out. Six of the nine closed green, and the average win of $216.4K was close to 10 times the average loss of $21.8K, giving a profit factor of 19.84. Winners were held about 2 days 5 hours and losers about 3 days 4 hours.

Trader Spotlight: Shadow Wallaby#
Notional Exposure and PnL#
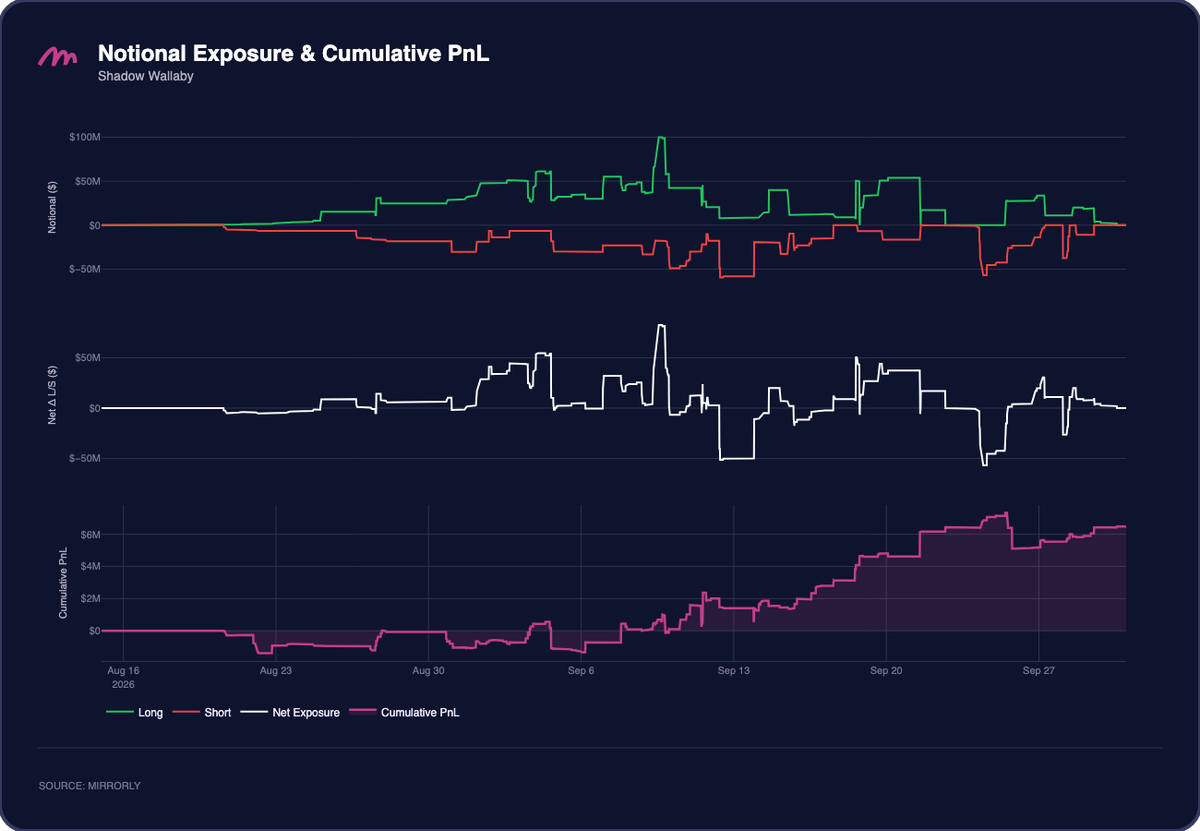
Shadow Wallaby ran a two-sided book and changed its direction repeatedly. He started September net long by roughly +$35M to +$55M, with longs of +$50M to +$60M against shorts of -$15M to -$30M, and around September 9 the long book briefly reached about +$100M. Within three days he had reversed to roughly -$50M net short, held from September 12 to 14 as the majors slid toward their lows. He rotated back to about +$50M net long on September 18 and 19, in time for the rally, and flipped again to about -$57M on September 24 as the market pulled back.
Positions carried from August left his cumulative PnL at about -$1M entering September, with a low near -$1.3M on September 6. It recovered to about +$2.3M by September 11 and then accelerated in the rally week, from about +$3.1M on September 18 to +$6.2M by September 21. It peaked near +$7.2M on September 25, dropped by about $2M the next day as losing shorts were closed, and recovered to finish at +$6.49M.
Positions PnL by Symbol#
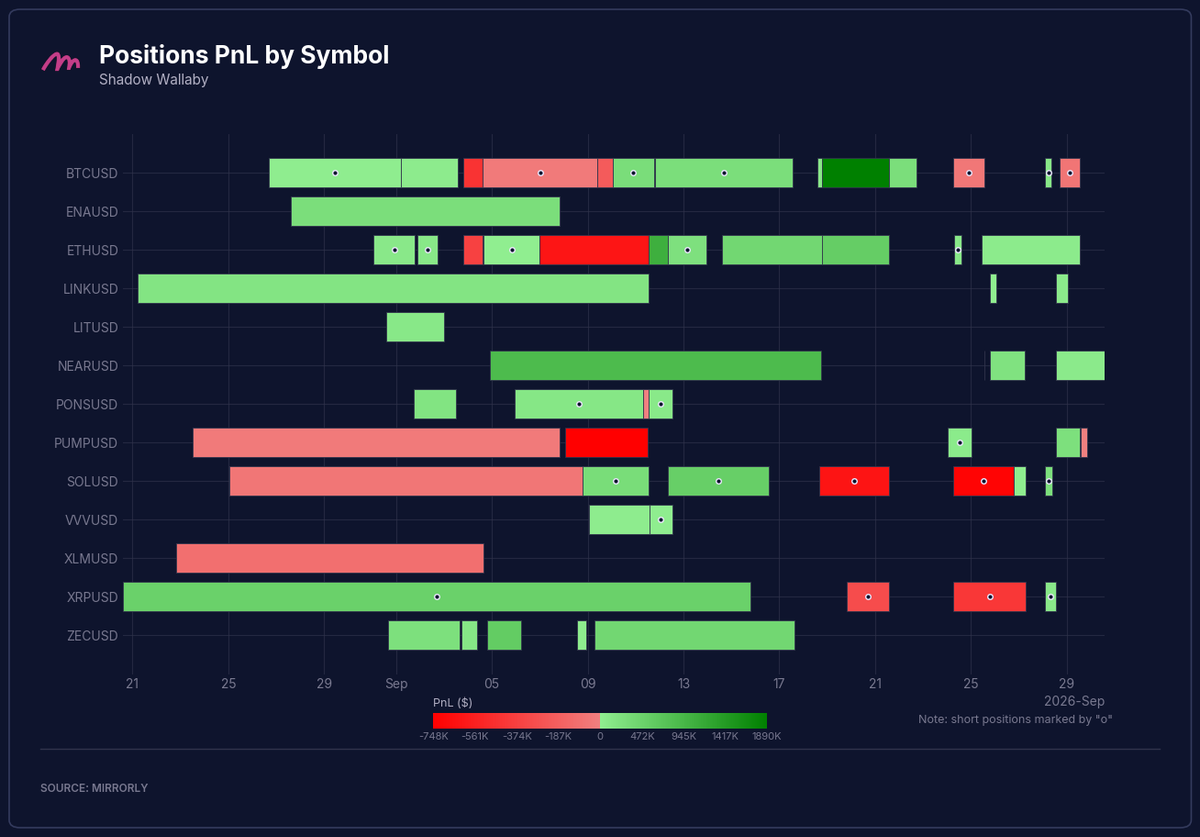
Shadow Wallaby traded 13 symbols, the broadest set he has shown in a monthly report. The largest winner was a $BTC long held from about September 19 to 21, alongside a $NEAR long carried from September 5 to 18. The red positions were concentrated in $ETH and $PUMP longs closed around September 11, and in $SOL and $XRP shorts closed in the final ten days.
Total PnL by Symbol#
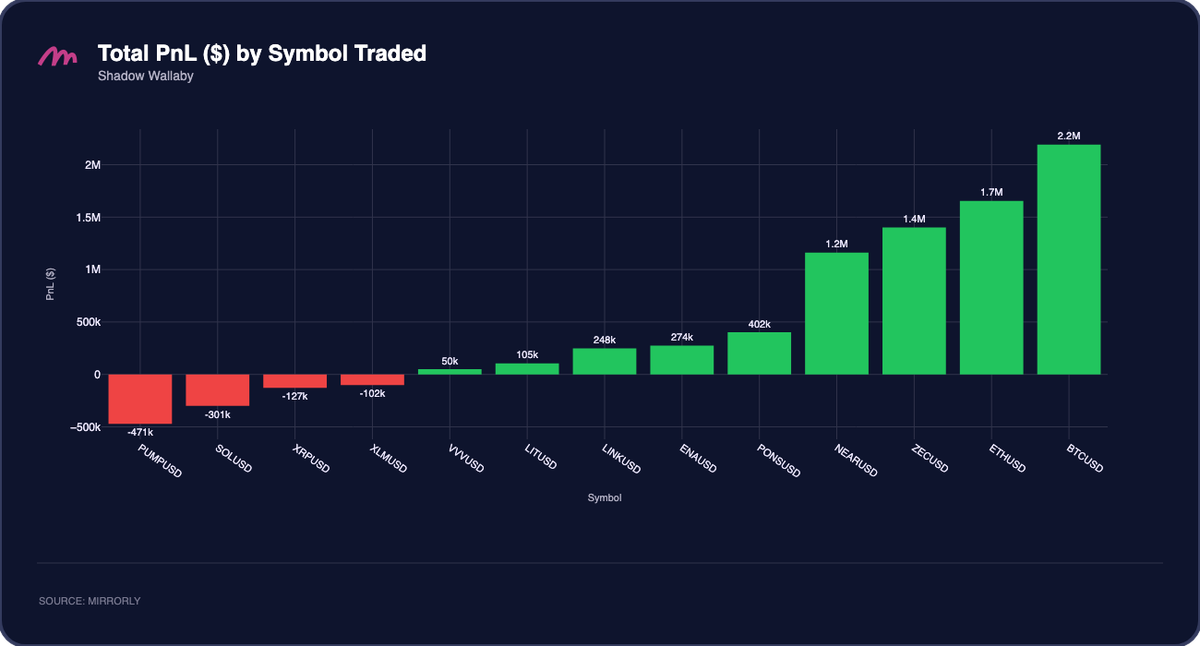
Four symbols carried the month: $BTC at about +$2.2M, $ETH at +$1.7M, $ZEC at +$1.4M, and $NEAR at +$1.2M, together roughly $6.5M, about the same as the entire monthly result. $PONS, $ENA, $LINK, $LIT, and $VVV added about $1.1M more. On the losing side, $PUMP cost about -$471K, $SOL -$301K, $XRP -$127K, and $XLM -$102K. Combined losses of roughly $1.0M absorbed about 13% of gross gains, a lighter drag than the 25% recorded in August.
PnL Distribution#
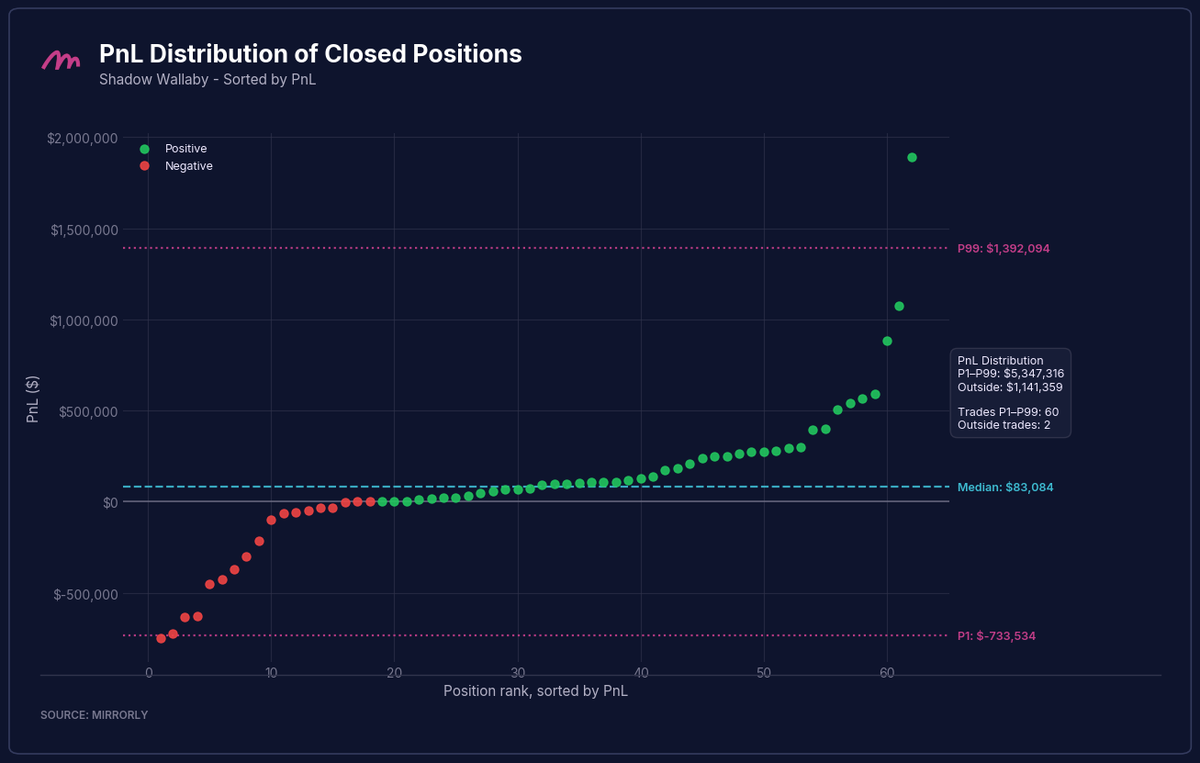
Shadow Wallaby's distribution again shows a positive median and a heavy tail on both sides. The median closed position was +$83.1K, with 44 of 62 finishing green. The 60 positions inside the P1 to P99 range (+$1.39M and -$734K) produced +$5.35M, about 82% of the monthly total, while the two outside it netted +$1.14M. The losing tail remains the feature to watch, with four positions closing between roughly -$630K and -$750K. The winning side was deeper, led by three positions between about +$880K and +$1.89M, but with average wins and losses of similar size the result came from winning about 2.4 positions for every one lost.
Trader Spotlight: Silent Viper#
Notional Exposure and PnL#
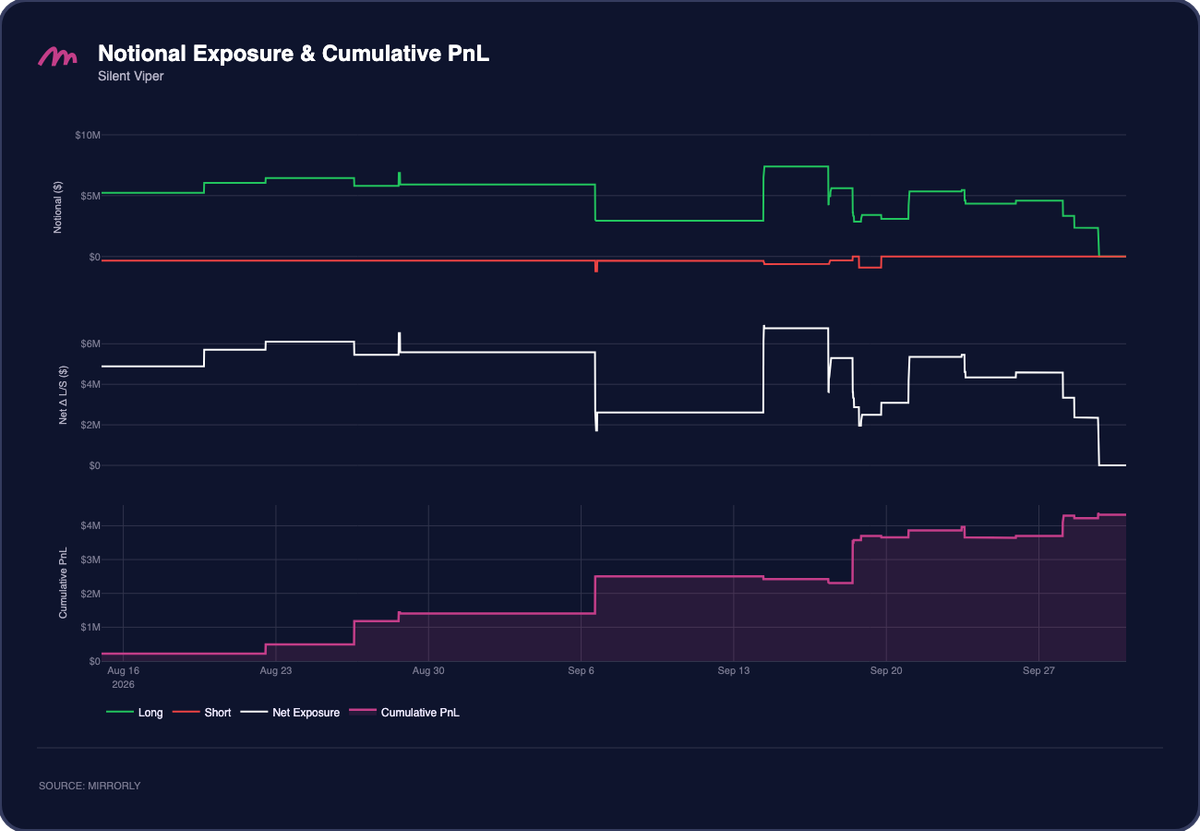
Silent Viper's book looks nothing like Shadow Wallaby's: long throughout, small relative to the profits it produced, and adjusted only a handful of times. Long notional held between about +$5M and +$6.5M from mid-August until September 6, when it was cut to roughly +$3M. It was raised to about +$7.5M on September 14, just ahead of the rally, then trimmed in steps until the book was flat by September 29. The short book never exceeded about -$1M.
The PnL curve is a staircase with shallow pullbacks. Reductions on positions carried from earlier months had already taken it to about +$1.4M by the end of August. It stepped up to +$2.5M on September 6, jumped to roughly +$3.6M on September 18 as positions were closed into the rally, and took a final step on September 28 to finish at +$4.3M. No pullback exceeded about $250K, consistent with his 7.78 profit-to-drawdown ratio.
Positions PnL by Symbol#
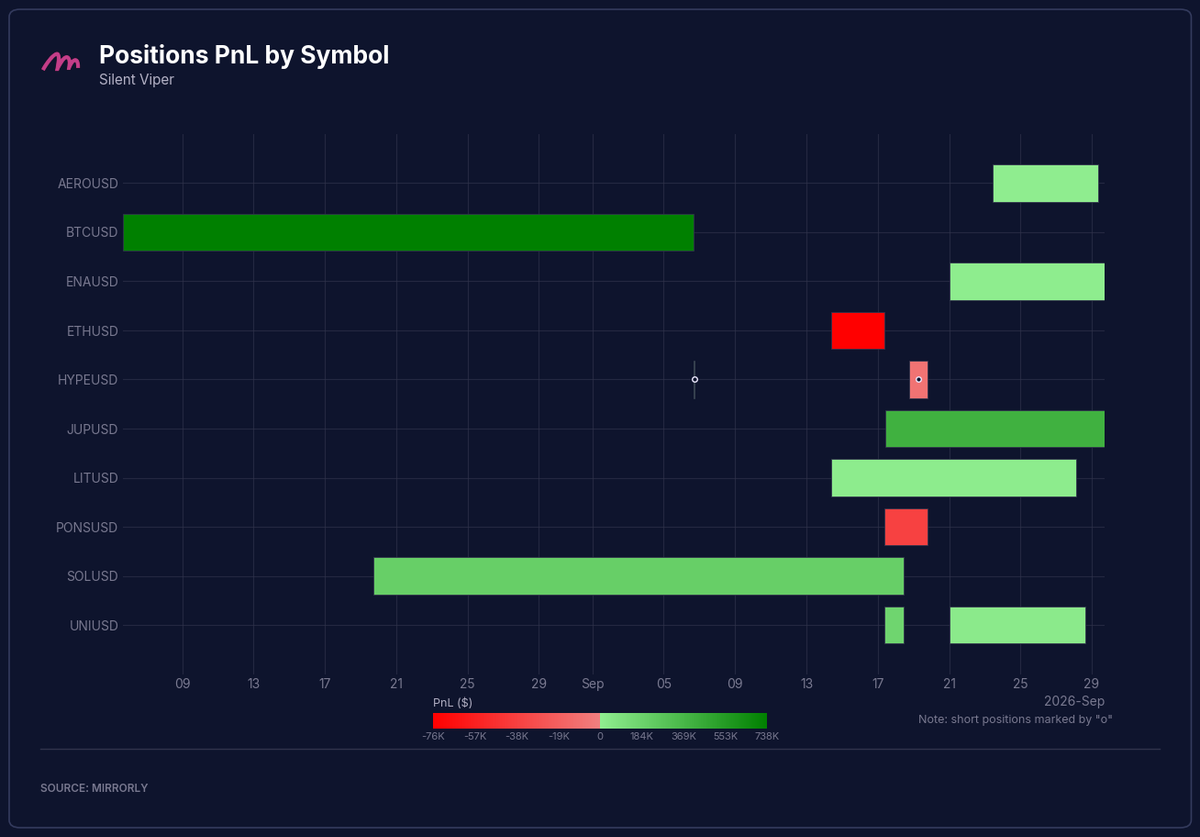
Silent Viper was long across majors and DeFi names, with two brief $HYPE shorts as the only short exposure. Two multi-week holds stand out: a $BTC long carried from early August to September 6 and a $SOL long held from August 20 to September 18. Most of the remaining positions were opened after September 14, led by a $JUP long held to month end.
Total PnL by Symbol#
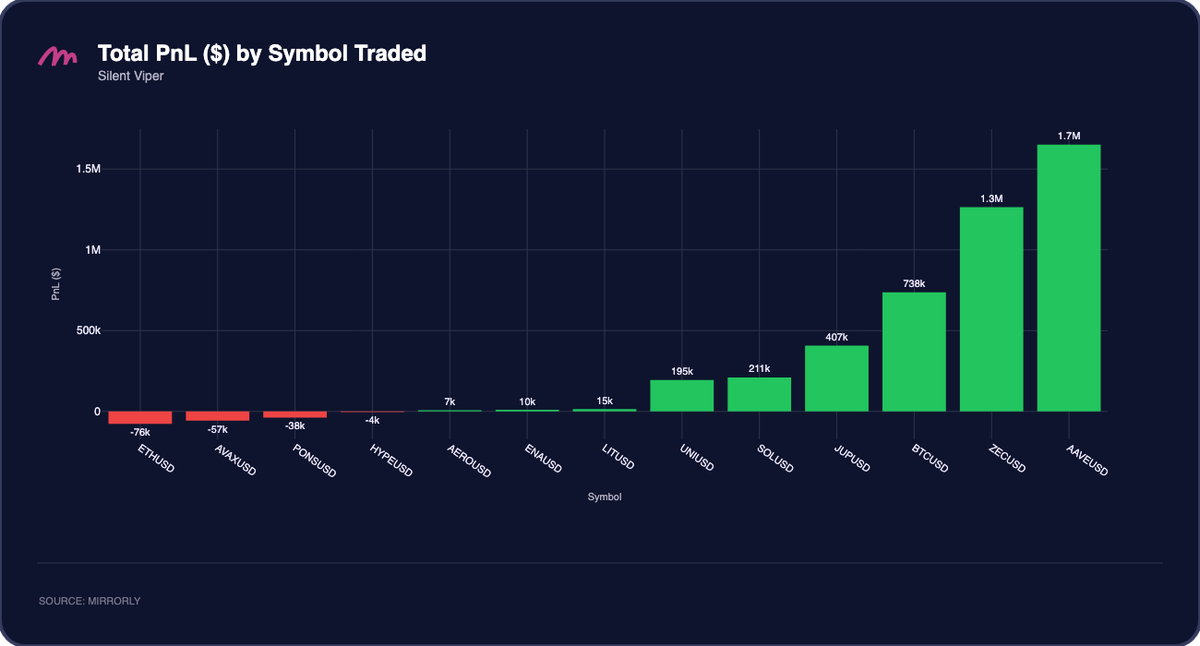
$AAVE led at about +$1.7M, followed by $ZEC at +$1.3M and $BTC at +$738K. Together they contributed roughly $3.7M, about 85% of the monthly total, with $JUP (+$407K), $SOL (+$211K), and $UNI (+$195K) adding a further $813K. Losses were small by comparison: $ETH, $AVAX, $PONS, and $HYPE cost a combined $175K, under 4% of about $4.5M in gross gains.
PnL Distribution#
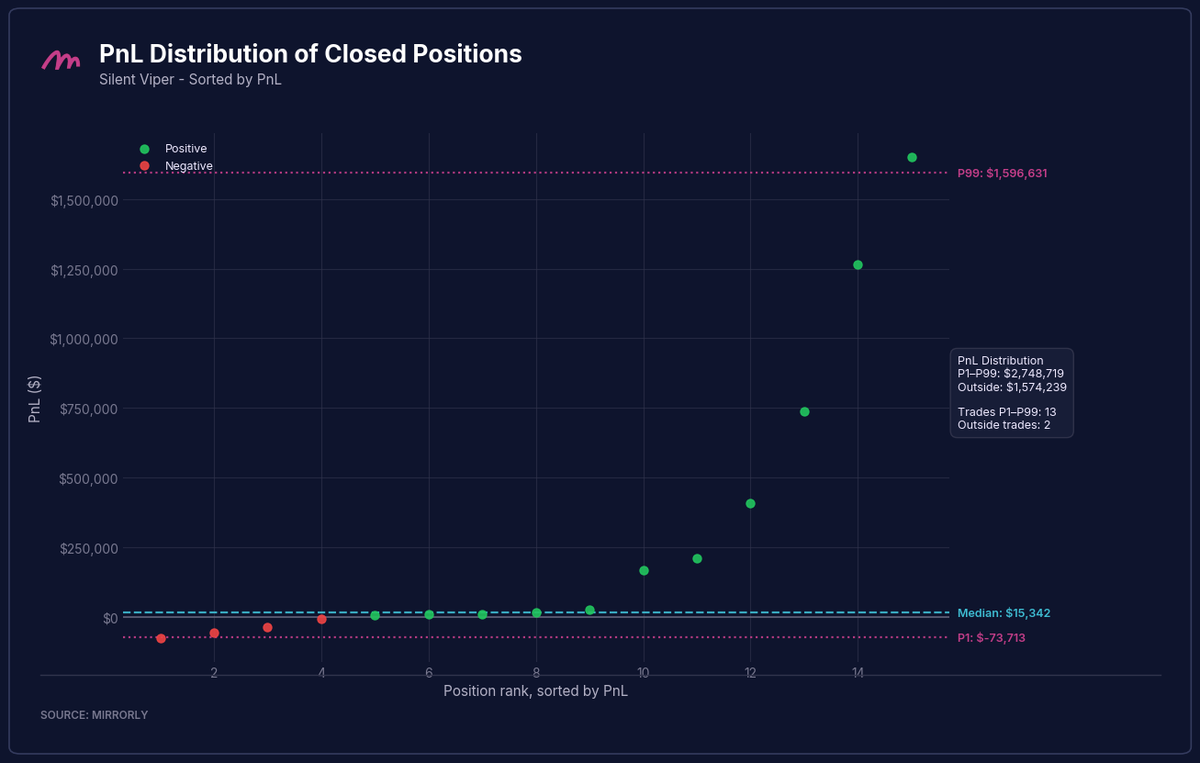
Silent Viper's distribution is strongly skewed to the upside. The median closed position was +$15.3K, with 11 of 15 finishing green. The 13 positions inside the P1 to P99 range (+$1.60M and -$74K) produced +$2.75M, while the two outside it added +$1.57M, about 36% of the monthly total. The five largest winners, from roughly +$211K to +$1.65M, account for essentially the entire result, while the four losses all fell between about -$4K and -$76K. The top winner was close to 22 times the worst loss.
Trader Spotlight: Flash Reindeer#
Notional Exposure and PnL#
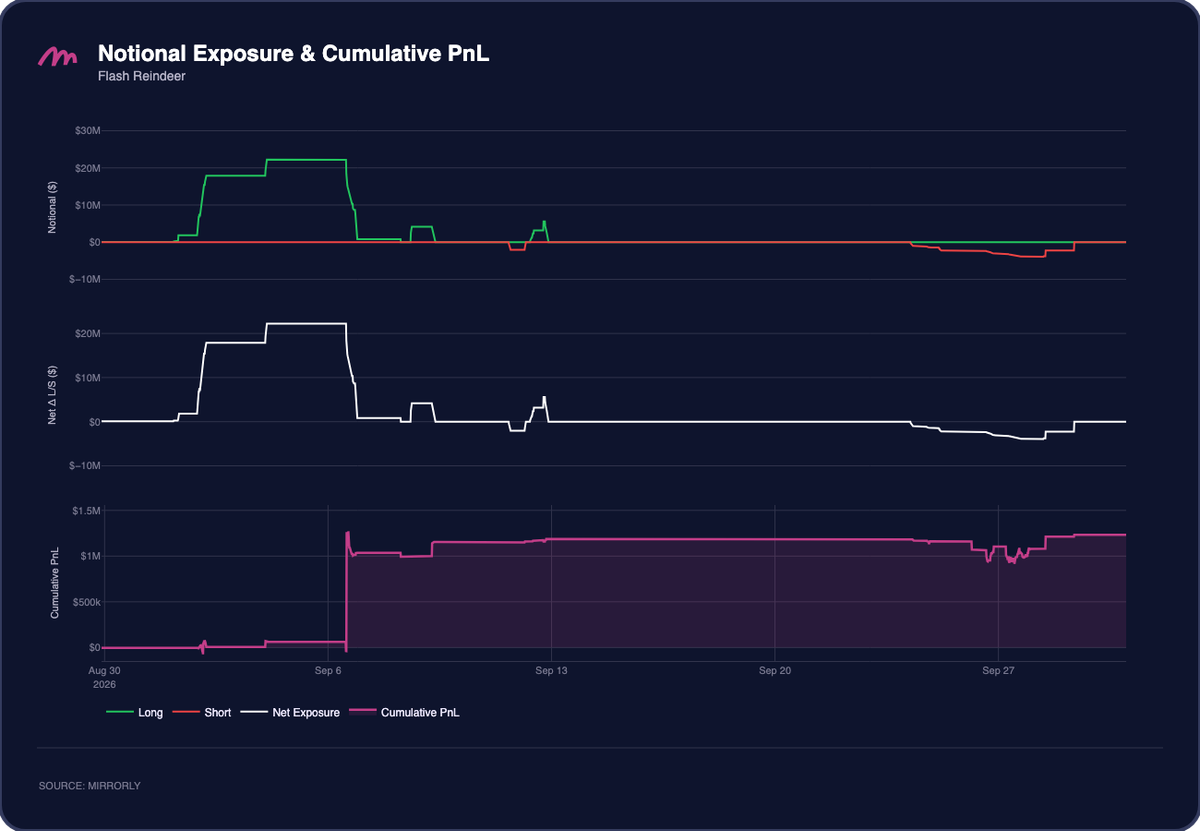
Flash Reindeer's month was concentrated in its first week. He scaled a long from about $1.5M on September 1 to roughly +$22M by September 4, held it for two days, and unwound it across September 6 and 7. What followed was far smaller, with longs of $3M to $5.5M and a brief -$2M short between September 8 and 12. He was then flat for eleven days, sitting out the entire rally, and returned only with a short book that built to about -$4M between September 24 and 28.
The PnL curve is a single step. Cumulative PnL sat below +$100K through September 5, jumped above +$1.2M on September 6 as the large long was closed, and was near +$1.19M by September 13. The late-month shorts produced the only visible drawdown, a dip to roughly +$950K on September 26 and 27, before the curve recovered to finish at +$1.23M.
Positions PnL by Symbol#
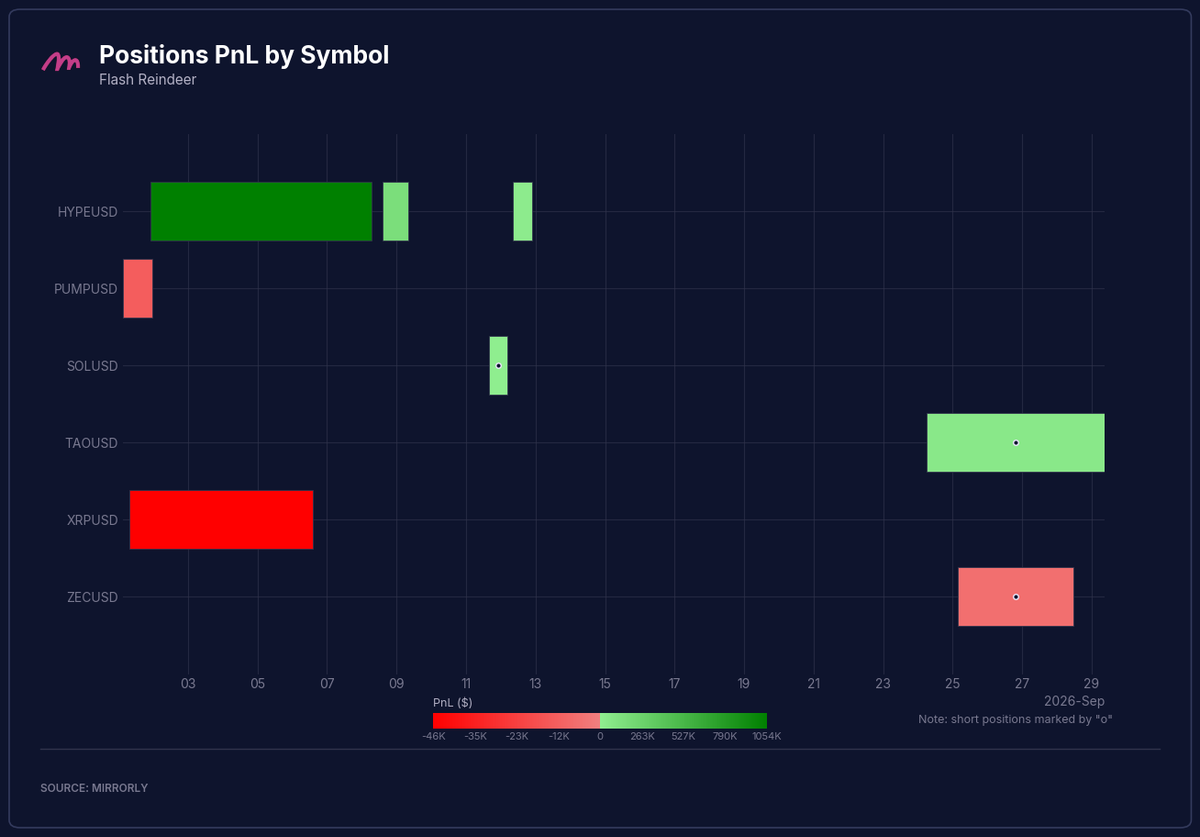
Flash Reindeer traded six symbols: $HYPE, $PUMP, $SOL, $TAO, $XRP, and $ZEC. The month was defined by one $HYPE long held from September 2 to 8, followed by two shorter $HYPE longs that also closed green. The last week consisted of a $TAO short and a $ZEC short.
Total PnL by Symbol#
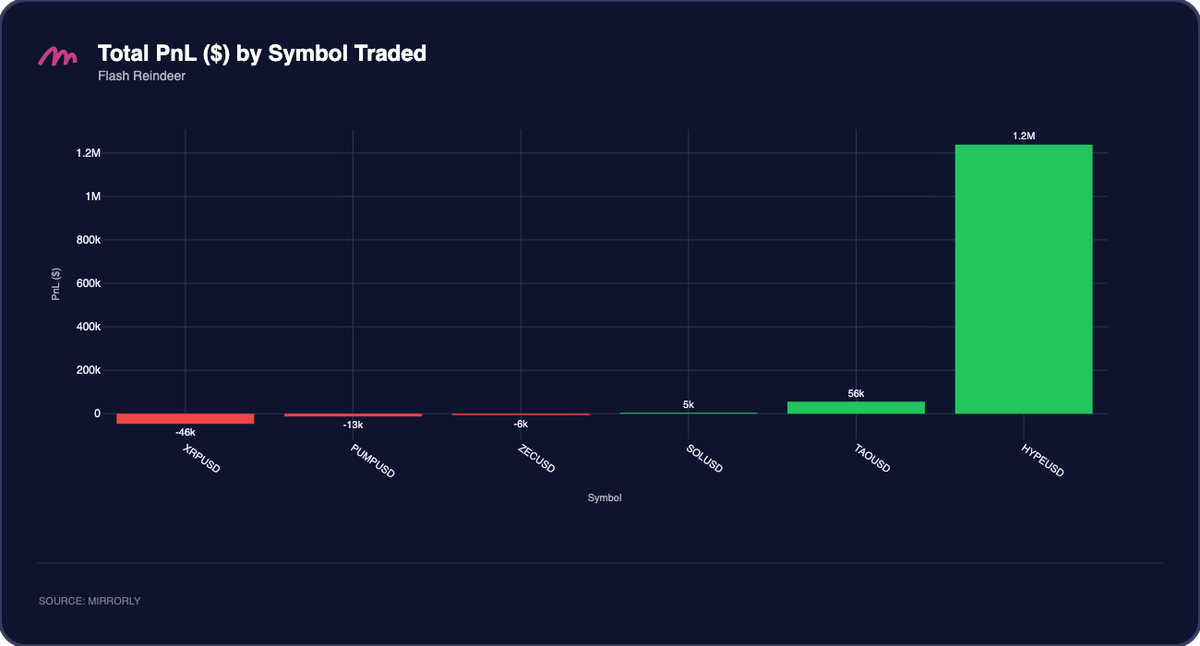
$HYPE contributed about +$1.24M across three longs, essentially 100% of the monthly total, in a month when the token itself finished up less than 2%. The gains came from buying near the early-month low and selling into the September 6 high. $TAO added +$56K and $SOL about +$5K, while $XRP (-$46K), $PUMP (-$13K), and $ZEC (-$6K) cost a combined $65K.
PnL Distribution#
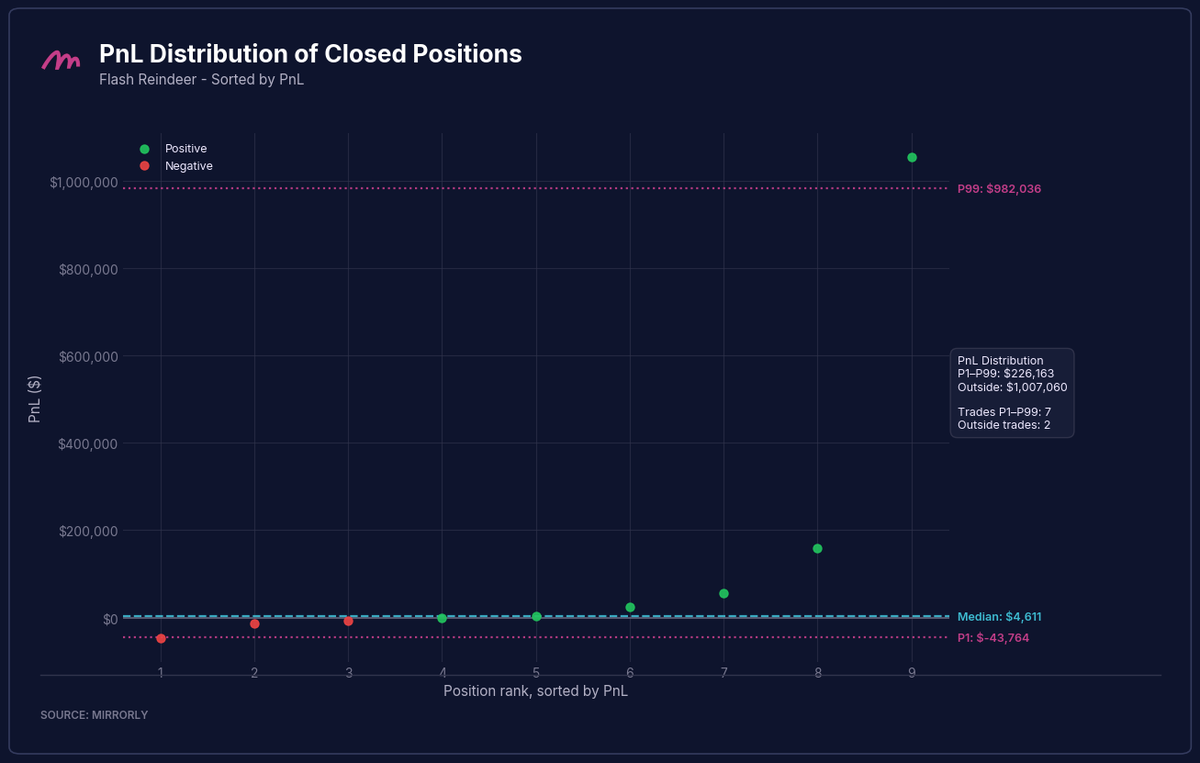
With only nine closed positions, Flash Reindeer's distribution is the most concentrated of the three. The median was +$4.6K, and six positions finished green. The seven positions inside the P1 to P99 range (+$982K and -$44K) produced +$226K, while the two outside it netted +$1.01M, about 82% of the monthly total. The top winner near +$1.05M was worth roughly 85% of net PnL on its own and about 23 times the worst loss, with all three losses contained between about -$6K and -$46K.
Case Study - The Price of a 71% Win Rate: Inside Shadow Wallaby's Drawdowns#
Shadow Wallaby's spotlight showed a 71% win rate built on average wins and losses of similar size, and the lowest profit-to-drawdown ratio in the table. To see what that looks like inside a position, we rebuilt the running PnL of each of his September positions from his fills and measured two things: the deepest open loss a position reached while held (maximum adverse excursion, or MAE) and the best open profit it reached (maximum favorable excursion, or MFE). The figures below cover 60 positions on a 5-minute basis, gross of fees and funding, so totals differ slightly from the spotlight.
The average position sat $294K underwater at its worst point to earn an average of $111K. Winners were not exempt. His 41 winners averaged +$274K after an average open drawdown of -$210K, and 16 of them were at some point deeper in the red than the profit they finally booked. Twelve winners went more than $250K underwater, and those twelve produced about $4.8M of PnL. The chart below shows the averages: even his winning positions reached an average open loss equal to about three quarters of the profit they closed with.
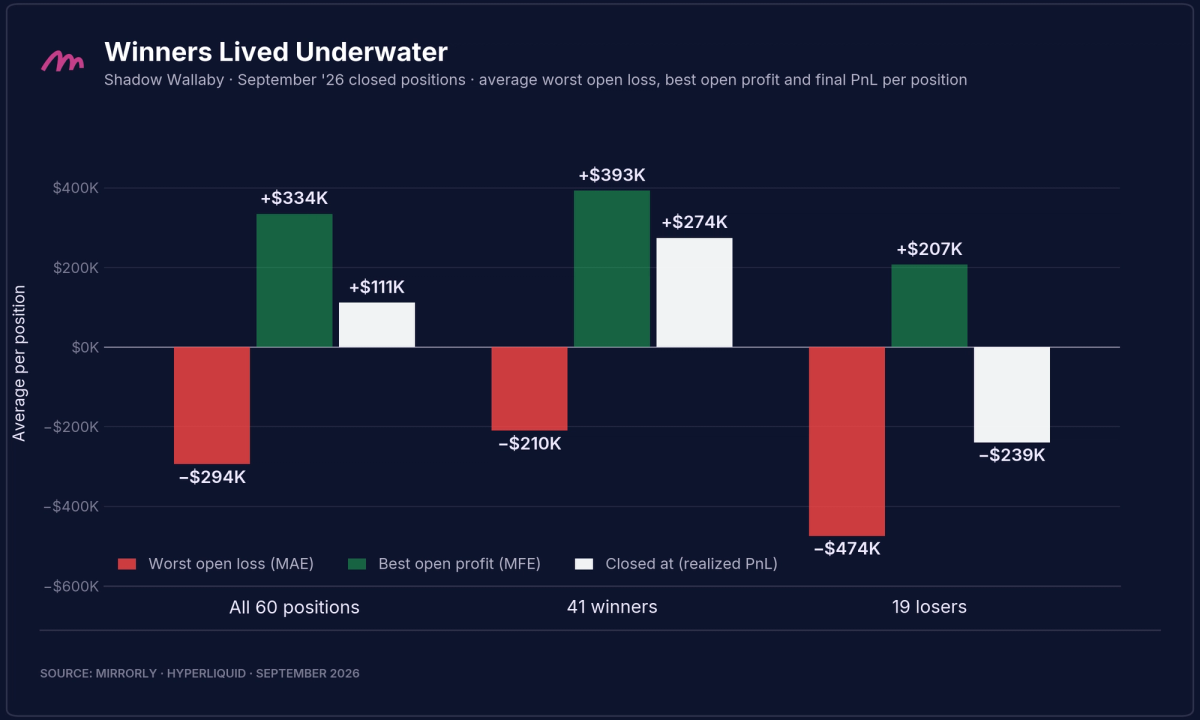
The losers explain the other half of the profile. His 19 losing positions reached an average open loss of -$474K but closed at an average of -$239K, about half of their worst point, and 13 of them had been more than $100K in profit before turning. He does not cut at the lows. He holds, often adds, and exits after a partial recovery: position size at the moment of maximum drawdown was a median 94% of peak size. The $ETH long closed on September 11 is the clearest case. It was his largest position of the month at about $50M notional, fell to -$1.52M, and was closed at -$626K. The $PUMP long closed the same day is the exception, cut at -$747K, essentially its low.
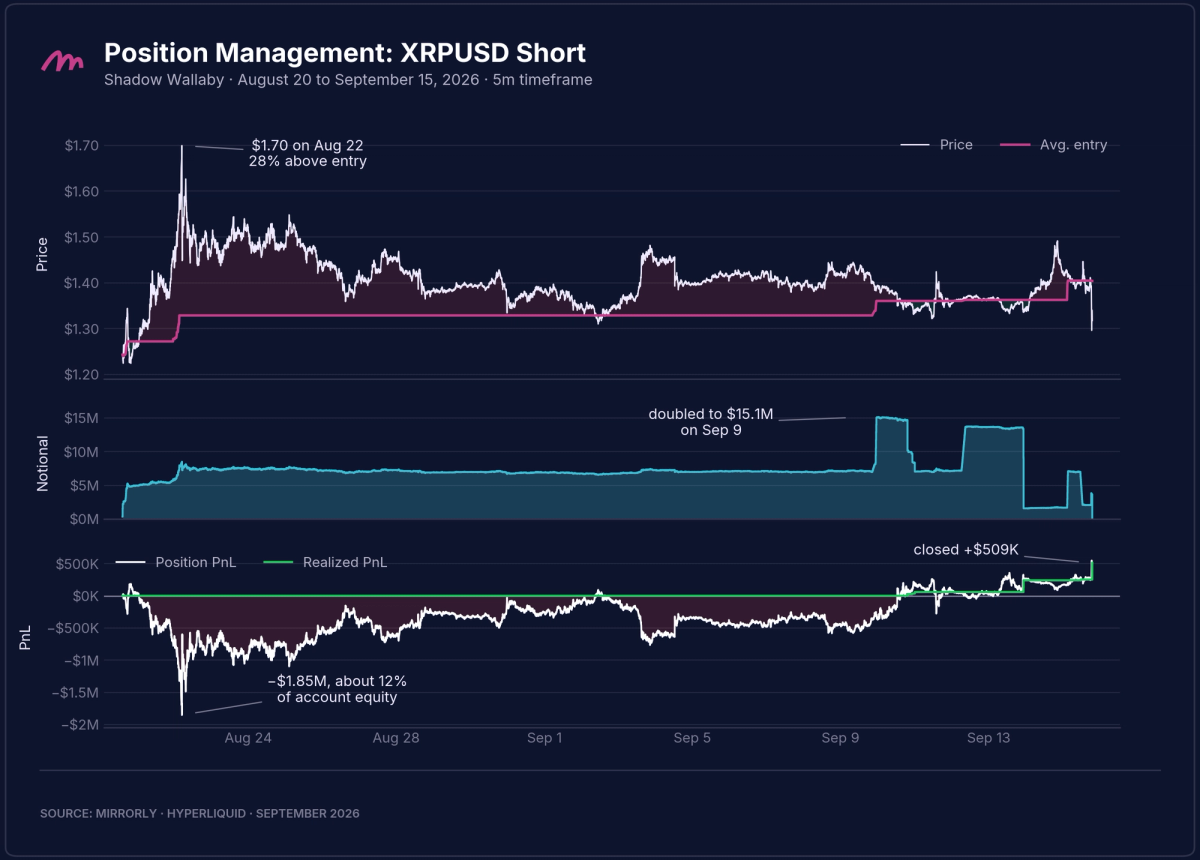
The $XRP short shows the profile at its extreme. He opened it on August 20 near $1.24 and built it to 5M $XRP, about $7M to $8M of notional, at an average entry of $1.33 by August 22. That day $XRP reached $1.70, 28% above his entry, and the position showed an open loss of -$1.85M. He did not reduce. For the next eighteen days he held the same size while the position stayed almost entirely underwater, mostly between -$300K and -$1M. On September 9 he doubled it to $15.1M of notional near $1.39, lifting his average entry to $1.36, and covered half the next day as price dropped to $1.33. He repeated the add on September 12, covered again on September 13, and closed the remainder on September 15 near $1.30 for a total of +$509K. The position was underwater for about 80% of its 26 days.
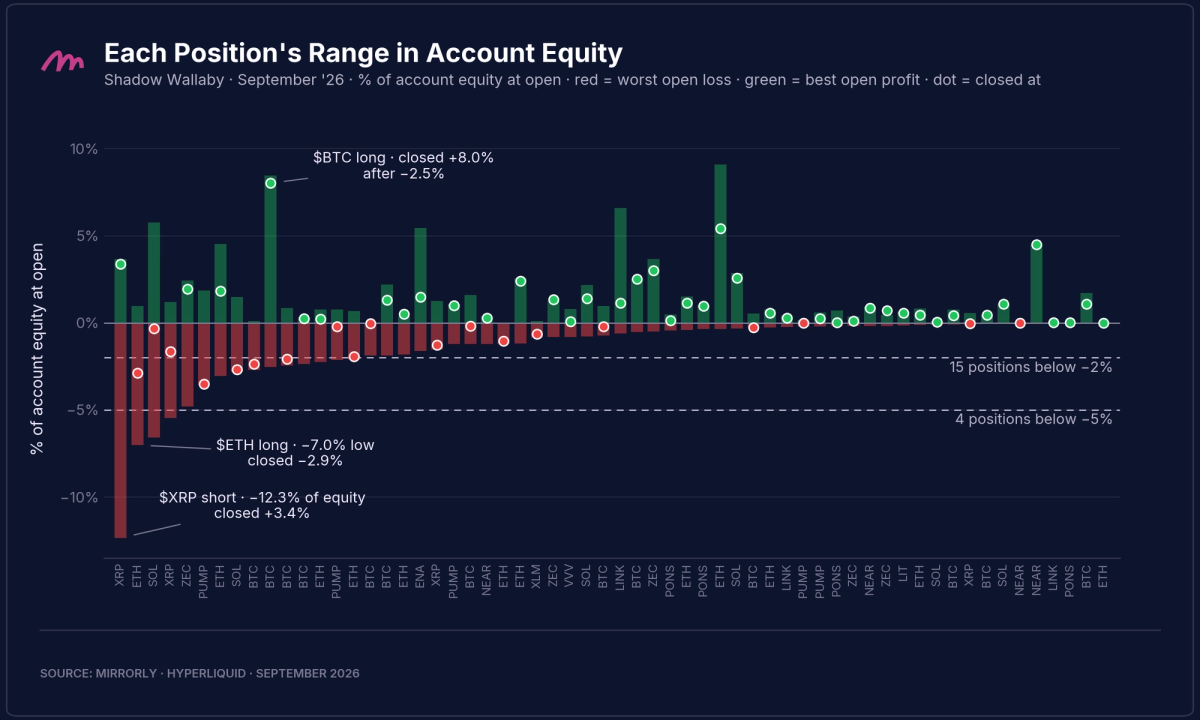
Dollar figures understate or overstate risk depending on the account behind them, so the last chart expresses each position against his Hyperliquid account value at the time it was opened, which ranged from about $19M to $26M during September. Each red bar is a position's worst open loss, each green bar its best open profit, and the dot marks where it closed. The average position drew down 1.45% of account equity at its worst and returned 0.54%. Fifteen positions drew down more than 2% and four more than 5%. The $XRP short cost 12.3% of account equity at its low before finishing at +3.4%, while his best position, the $BTC long closed on September 21, returned +8.0% after a drawdown of 2.5%. At the book level, the combined open PnL of these positions bottomed at about -$2.1M on September 25, roughly 8.5% of account equity, and gross notional peaked near $119M on September 9, about 5.9 times the account.
For copy traders, the win rate is the visible part of this profile and the drawdowns are what it costs. Shadow Wallaby wins often because he gives losing positions time and size to recover, backed by an account large enough to carry a seven-figure open loss for weeks. A copier who mirrors his entries but sizes more aggressively, or who applies a stop he does not use, would have been taken out of many of the positions that ended green: 16 positions moved more than 5% against him on notional, and 10 of those finished as winners worth about $2.0M. Copying him means accepting the same open drawdowns he does, in proportion to the copier's own account.
Conclusion#
September's range-then-rally tape produced three different routes to the top of the leaderboard. Shadow Wallaby traded both sides with size, flipped his net exposure repeatedly, and finished first at +$6.49M, with $BTC, $ETH, $ZEC, and $NEAR contributing about $6.5M between them. Silent Viper did close to the opposite: a small, long-only book held for about a month per position, adjusted a handful of times, and worth +$4.32M with the best profit factor and profit-to-drawdown ratio in the table. Flash Reindeer earned +$1.23M from essentially one trade, a $HYPE long bought near the early-month low and sold into the September 6 high, and then sat out the rally entirely.
The case study shows what sits behind the month's largest number. Shadow Wallaby's 71% win rate comes from giving losing positions time and size to recover: his average position sat $294K underwater to earn $111K, and one $XRP short carried an open loss worth 12% of his account before closing green. For copy traders, a high win rate and a large monthly profit say little on their own. The open drawdown a trader accepts on the way there, measured against the account behind it, is what a copier has to be able to carry.
Join Mirrorly:#
Subscribe to our Notifications so you don't miss next month's report!