
Quarterly Insight - Q3 2026#
"Rising tide, uneven catch: one trader booked 44% of the top ten's profit."
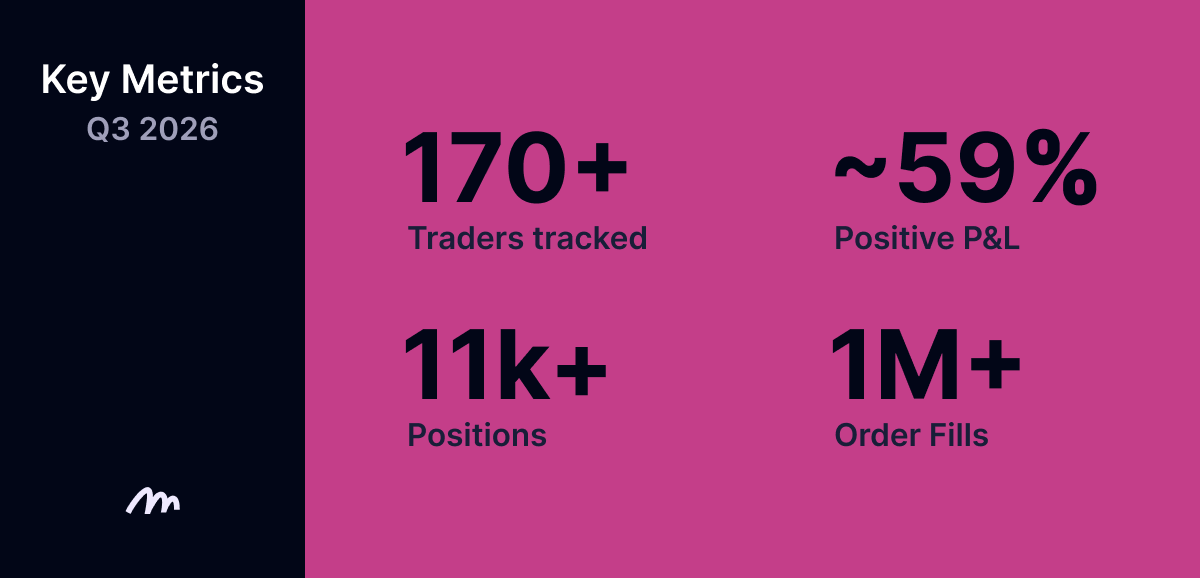
In Q3 2026, Mirrorly tracked over 170 traders across Hyperliquid and Binance Smart Money. It was the first quarter of the year in which every major benchmark finished higher, yet only about 59% of tracked traders finished profitable, slightly below the 62% recorded in Q2. Over the period, the platform recorded more than 11k closed positions and over 1 million individual order fills. Every figure in this report is realized PnL on closed positions. Open positions are excluded, so the numbers reflect what these traders booked, not paper gains.
Market Overview#
Q3 2026 broke the pattern of the first half. After Q1's broad drawdown and Q2's range-bound chop, Q3 was a broad rally, with all four benchmark assets closing the quarter positive. The first half of the quarter was quiet. Through July and into mid-August, $ETH drifted up to roughly +20% and $BTC held around +10%, while $SOL hovered near flat and $HYPE slid to about -20% by early August. Around August 18 to 20, the market repriced in a matter of days, with every asset gaining 20 to 40 percentage points and $ETH reaching about +55%. Prices held that range into mid-September before a second leg higher around September 20.
$ETH led the quarter at +67.5%, followed by $SOL at +57.9% and $BTC at +40.7%. $HYPE, the relative-strength outlier in both Q1 and Q2, finished last of the four at +31.0%, after peaking near +48% in late September and fading into quarter end.
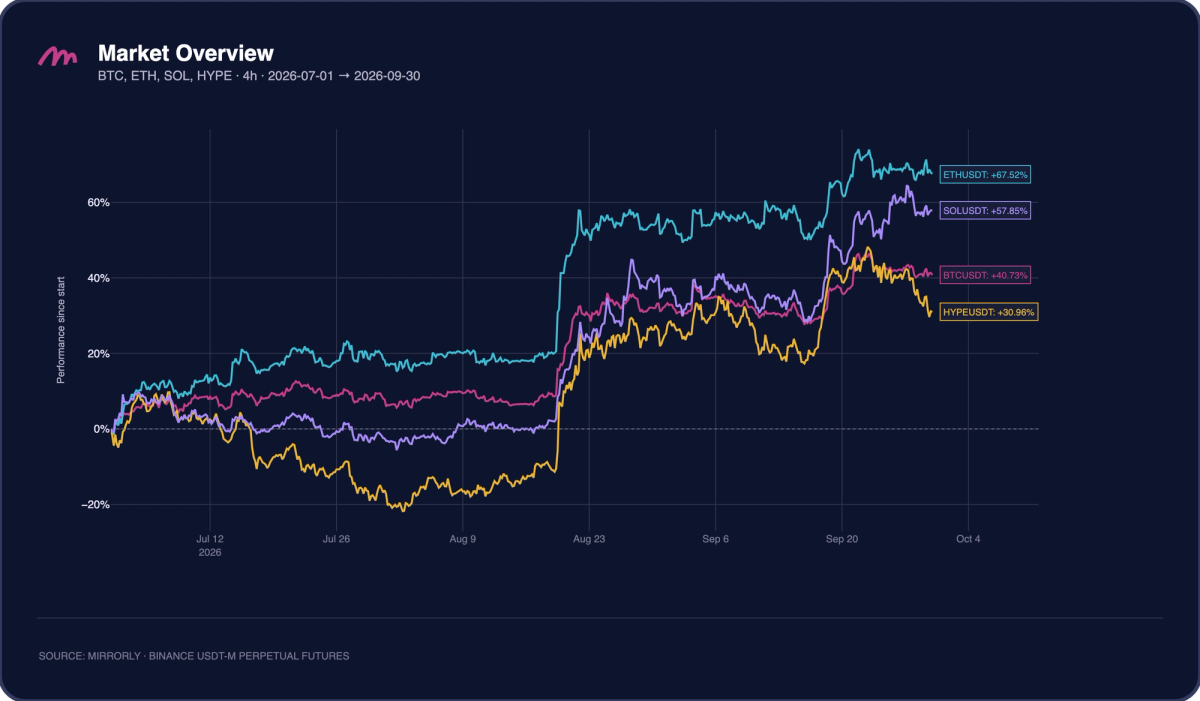
Long exposure to majors finally paid, but most of the quarter's gain arrived in two short windows, so timing mattered as much as direction. The rest of this report focuses on the ten traders with the highest realized PnL on the Mirrorly leaderboard during Q3 2026, based on all traders tracked over the period.
Top Performers of the Quarter#
Q3 produced the most concentrated leaderboard of the year. The top ten ranged from $965K to $13.02M and together booked about $29.4M, but Shadow Wallaby alone accounted for $13.02M, roughly 44% of that total and more than three times the second-place trader. The top three generated about $19.4M, below Q2's $22M, and the entry bar for the top ten fell under $1M for the first time this year.
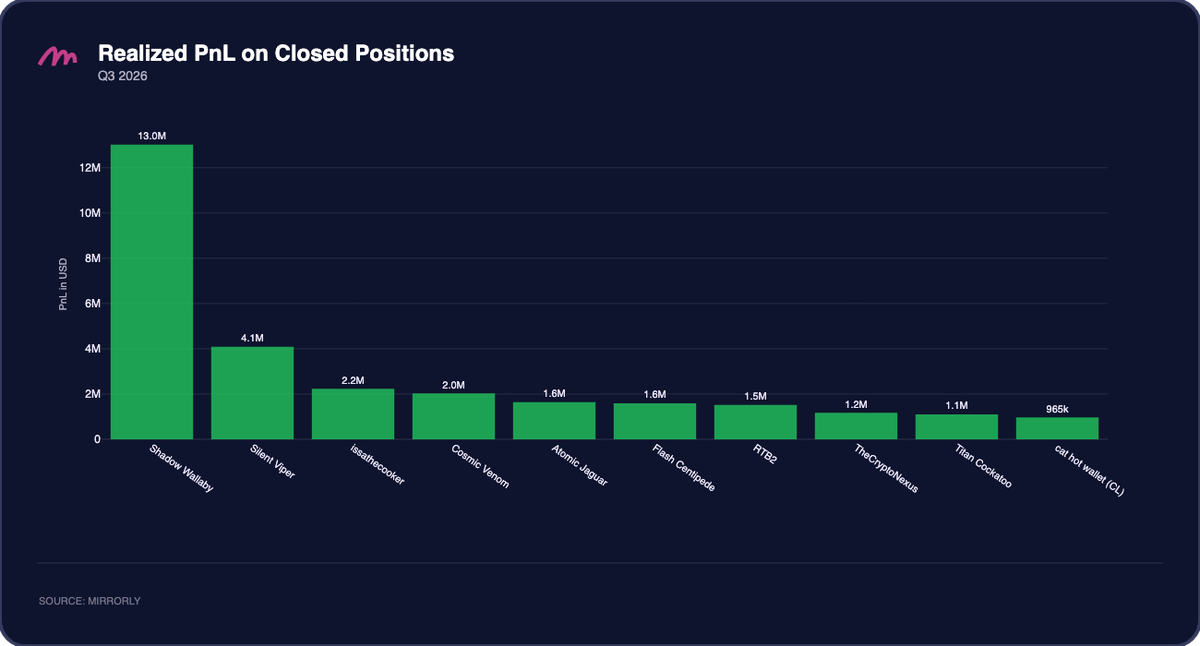
Shadow Wallaby is the only trader to appear in the top ten in all three quarters of 2026, and its results have grown each time: $2.46M in Q1, $7.60M in Q2 (second place), and $13.02M in Q3. Trade count grew alongside PnL, from 11.5k in Q1 to 19.5k in Q2 and 43.3k trades across 112 positions this quarter. The book runs on win rate. At 71.4%, wins outnumbered losses by about 2.5 to 1, which carried a 2.28 profit factor even though the average loss ($318.71K) was larger than the average win ($290.24K) and losing positions were held almost twice as long (6d 17h vs 3d 17h). Its average profit-to-drawdown ratio of 0.70 was the lowest in the group, meaning positions typically sat through drawdowns larger than the profit they eventually closed with.
Silent Viper ranked second with $4.09M from 29 positions, running the longest horizon in the group: winners and losers were both held for about a month on average (32d vs 31d). A 58.6% win rate was enough because the average winner ($282.11K) was about 4.8 times the average loser ($58.47K), producing a 6.83 profit factor. issathecooker took third with $2.24M from just 2 positions and 27 trades, both winners, averaging $1.12M each over roughly 3.75 days of holding time.
Win rates ran from 40.5% (cat hot wallet (CL)) to 100% (issathecooker). Cosmic Venom, back in the top ten after Q1, booked $2.03M from 13 positions at a 76.9% win rate. Its three losing positions averaged just $126, which pushes its profit factor to 8,015.87 and gives it the highest Sharpe ratio in the group (1.47). At the other end, cat hot wallet (CL) won fewer than half its 37 positions but still finished with $965K, because its average winner ($121.96K) ran about 3.1 times its average loser ($39.31K).
RTB2, also back from Q2, reached the top ten with the opposite profile from last quarter. In Q2 it won only 35.7% of its positions and relied on winners 6.5 times larger than its losers. In Q3 it closed 24 positions at a 75.0% win rate, with average win and loss nearly equal ($129.38K vs $134.73K), and held winners for 12.5 days against 4d 8h for losers. Same trader, same leaderboard tier, very different execution.
Trading intensity again varied widely. Atomic Jaguar ran the most trades in the group, 69.2k across 58 positions, for $1.64M at a 72.4% win rate, and like Shadow Wallaby held losers longer than winners (7d 16h vs 4d 20h). Titan Cockatoo did the reverse, holding winners for 25d 16h and cutting losers in 7d 8h, which supported a 3.71 profit factor on 19 positions. Flash Centipede combined a 76.0% win rate with a 5.27 profit factor across 25 positions and only 375 trades.
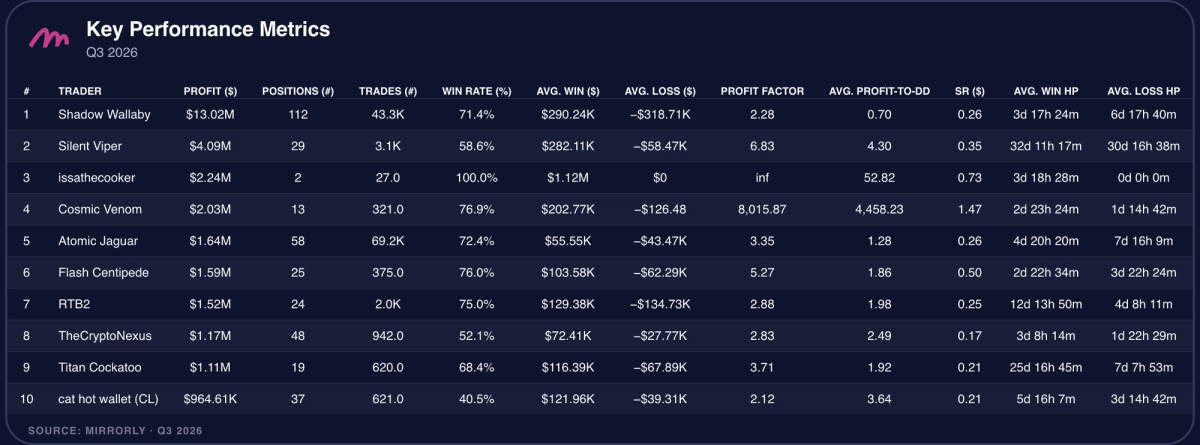
The Q3 leaderboard shows top-tier PnL reached through both very high and very low turnover, but with far more weight on a single book than in prior quarters. For Mirrorly copytraders, copying the Q3 leaderboard largely meant copying Shadow Wallaby, a high-frequency book whose losers are larger and held longer than its winners. That is a profile that requires capacity to sit through deep drawdowns, and a reason to pair it with lower-turnover, asymmetric profiles such as Silent Viper or Titan Cockatoo.
Where the Capital Was Deployed#
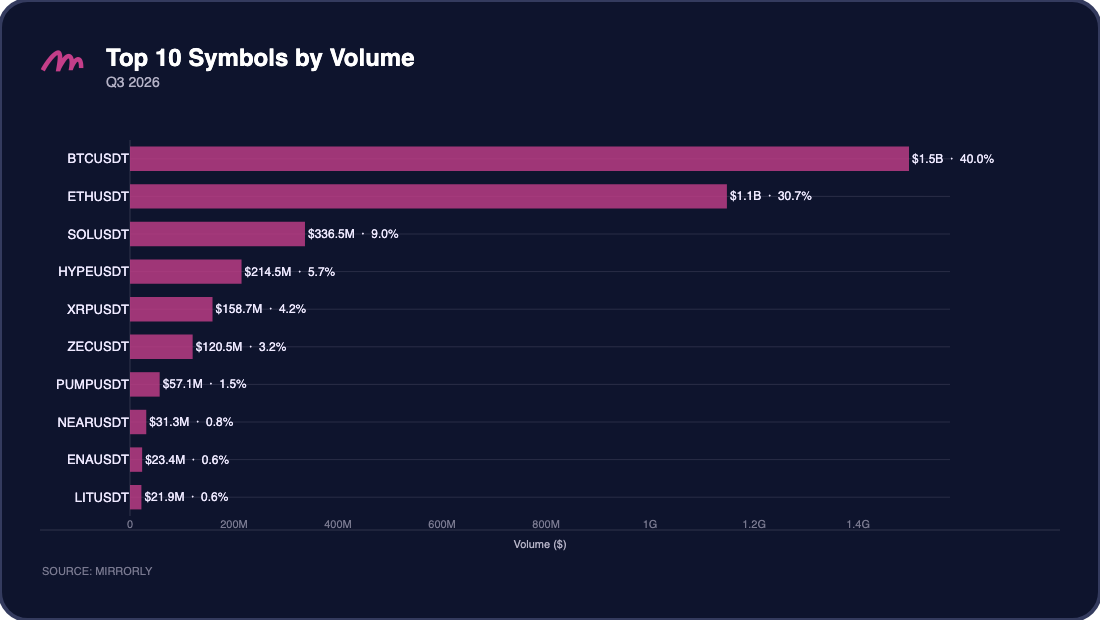
Trading volume rotated toward $ETH this quarter. $BTC remained the most-traded market at $1.5B (40.0% of volume), but its share fell from 51.4% in Q2 and 62.5% in Q1. $ETH rose to $1.1B (30.7%), up from 20.8% in Q2, in line with its leadership in price. Together the two carried about 71% of all volume. $SOL ($336.5M, 9.0%) moved ahead of $HYPE ($214.5M, 5.7%), whose share fell from 13.1% in Q2 as it lagged the other majors. As in previous quarters, the sample is small enough that a handful of large accounts can shift these shares as much as any broad change in behavior.
Beyond the top four, $XRP ($158.7M, 4.2%), $ZEC ($120.5M, 3.2%), $PUMP ($57.1M, 1.5%), $NEAR ($31.3M), $ENA ($23.4M), and $LIT ($21.9M) rounded out the top ten.
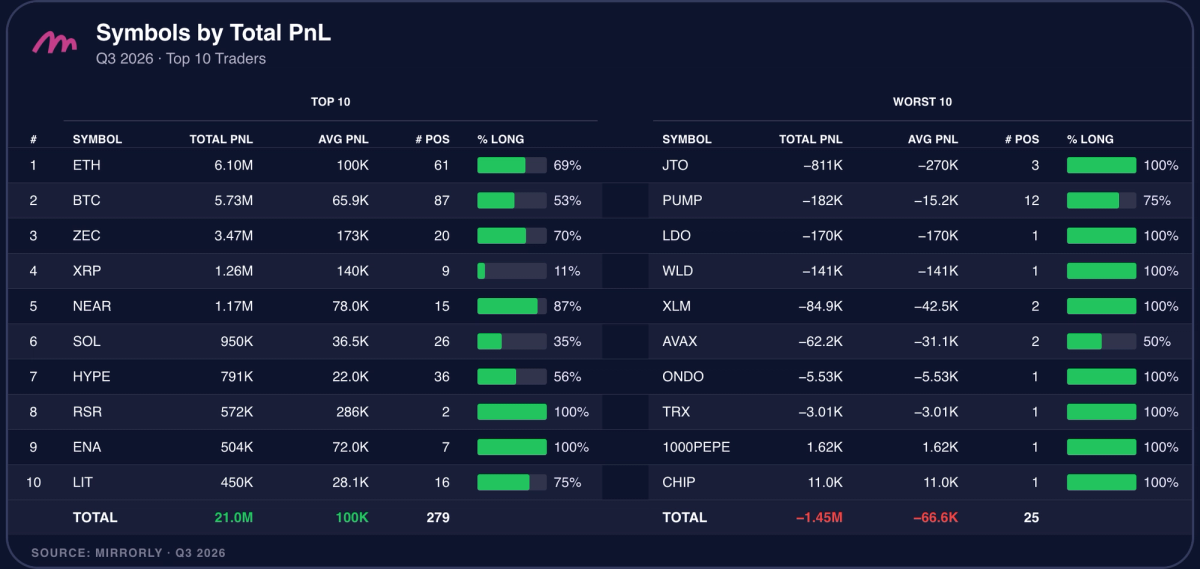
Among the top ten traders, $ETH was the largest profit source at $6.10M across 61 positions, ahead of $BTC at $5.73M across 87 positions. Together they generated about 56% of the $21.0M booked on the ten most profitable symbols. $ZEC was the standout third at $3.47M from just 20 positions, the highest average PnL per position among the top five ($173K), on only 3.2% of volume. In Q2, ZEC was the worst symbol in the group at -$277K. $XRP ($1.26M) and $NEAR ($1.17M) completed the top five, which together accounted for about $17.7M, or roughly 84% of the top ten symbols' PnL.
Position direction followed the rally more closely than in prior quarters. $ETH, the quarter's best performer, was traded 69% long, $ZEC 70% long, and $NEAR 87% long, while $BTC stayed nearly balanced at 53% long. The exceptions were $XRP at 11% long, which still returned $1.26M from 9 positions, and $SOL at 35% long, which netted $950K despite the asset finishing up 57.9%, a sign that the short side there was traded tactically rather than held through the trend. $HYPE, at 56% long, contributed only $791K across 36 positions, a long way from its role as a top-two profit source in Q1 and Q2.
Losses were small and concentrated. The worst-ten symbols together lost $1.45M across 25 positions, and only eight of them were net negative. $JTO alone lost $811K on 3 positions, about 56% of the total. Almost every loss came from the long side: $JTO, $LDO, $WLD, and $XLM were all 100% long, and $PUMP lost $182K across 12 positions at 75% long. In a majors-led rally, long bets on altcoins that did not follow were where the top traders gave back money.
How Returns Were Generated#
Measured by profit per unit of exposure, issathecooker was the most capital-efficient trader by a wide margin at $0.37 per $1 of volume, the highest figure recorded in any 2026 quarterly report and consistent with two positions held for a few days each. Cosmic Venom ($0.08) and Silent Viper ($0.05) followed, both low-frequency books. Titan Cockatoo and RTB2 sat at $0.02.
The rest of the group clustered at $0.01 or below. Atomic Jaguar, cat hot wallet (CL), Flash Centipede, and TheCryptoNexus registered about $0.01, and Shadow Wallaby rounded to $0.00, the lowest in the group for the second time this year, a direct result of the turnover behind its $13.02M.
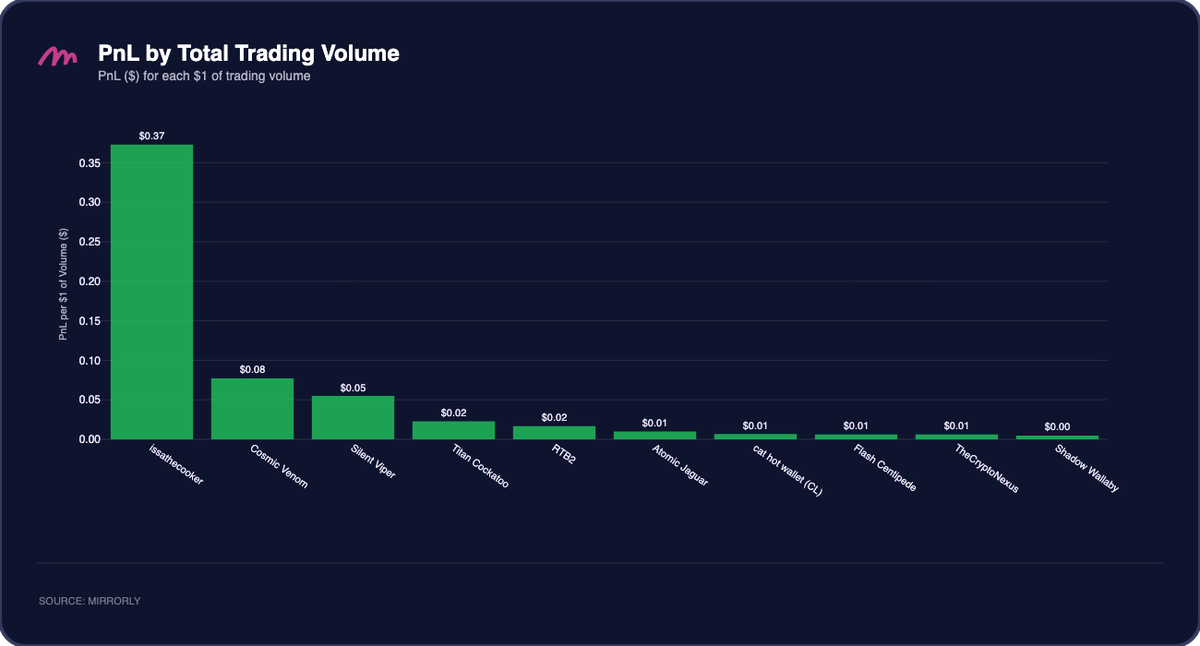
For Mirrorly copytraders, these differences matter. A higher PnL-per-Volume ratio does not by itself make a trader better or worse: the quarter's largest PnL came from the least efficient book. But lower ratios leave less room for execution costs and slippage, because fees and spread consume a larger share of gross returns. That matters most in copy-trading, where added latency erodes the edge of a high-turnover strategy more than a concentrated, low-frequency one.
Conclusion#
Q3 2026 was the first broad rally of the year. $ETH finished up 67.5%, $SOL up 57.9%, $BTC up 40.7%, and $HYPE up 31.0%, with most of the move arriving in two short windows in late August and late September. In that market, about 59% of tracked traders finished profitable on closed positions, and the top ten ranged from $965K to $13.02M.
The leaderboard was more concentrated than at any point this year. Shadow Wallaby, the only trader in the top ten in all three quarters, booked 44% of the group's PnL through 43.3k trades. Behind it, long-horizon asymmetric traders (Silent Viper, Titan Cockatoo), near-lossless low-frequency books (issathecooker, Cosmic Venom), and high win-rate operators (Atomic Jaguar, Flash Centipede, RTB2) each found their own way to seven figures. The symbol data adds a clear lesson: the top traders made their money long $ETH, $ZEC, and $NEAR and balanced in $BTC, and lost it on long altcoin bets that did not join the rally.
For Mirrorly users, how each trader generates returns, and how much of a leaderboard rests on a single book, matters as much as the returns themselves.
Want to track and copy the best traders on Binance and Hyperliquid?
Join Mirrorly to access real-time insights from top leaderboard accounts and follow their moves with precision.
👉 Join Here
Check out the blog for more insights: https://blog.mirrorly.xyz/
We track a carefully curated and regularly updated list of top-performing public traders across platforms like Binance and Hyperliquid. While we aim for high data accuracy, some limitations remain, such as traders switching to private mode or technical constraints like rate limits. Despite these challenges, we dedicate significant effort to ensure the data is as reliable as possible.