
Top Traders Report - July '26#
Introduction#
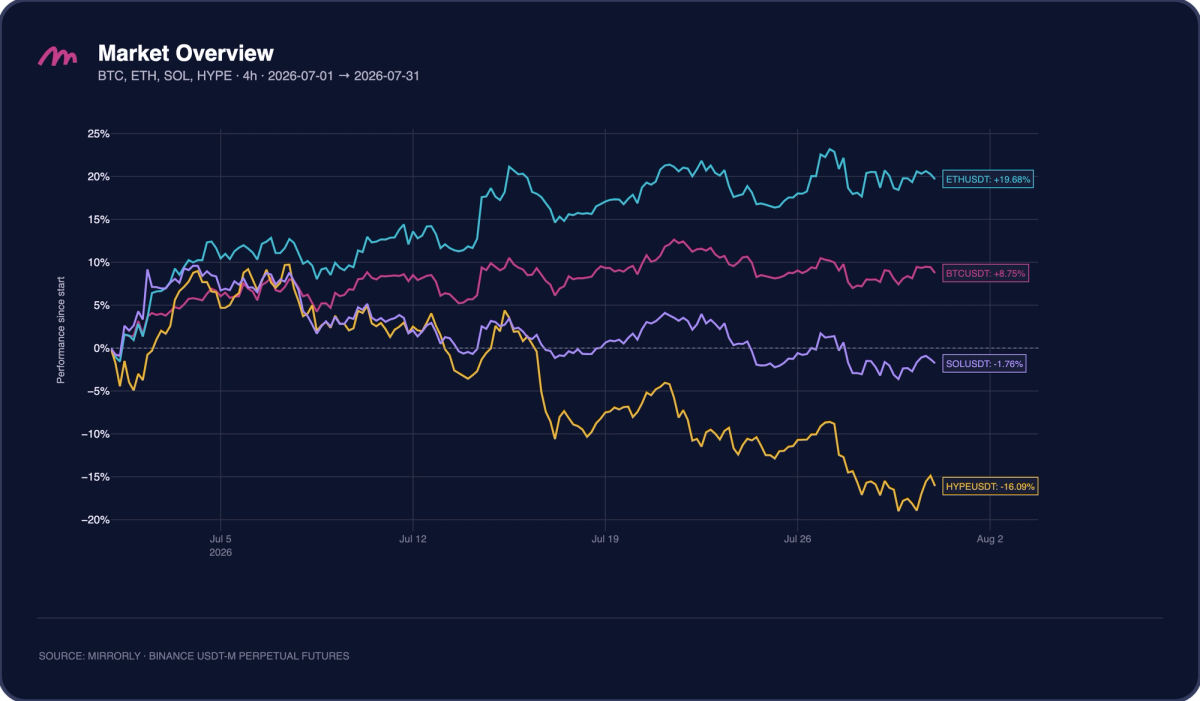
July was a month of wide dispersion across the major crypto perps. All four benchmarks rallied together through the first week, reaching roughly +5% to +10%, and then their paths split. $ETH was the clear leader, trending higher for most of the month, at one point above +23%, and closing up about +19.7%. $BTC ground out a steadier advance and finished around +8.8%. $SOL faded through the second half and closed slightly negative at roughly -1.8%. $HYPE was the outlier to the downside. After holding early gains near +9%, it broke down from mid-month, reached lows near -20%, and finished down about -16.1%.
This month Mirrorly’s top 3 traders are:
🏆 Shadow Wallaby (Hyperliquid): +$1.98M
🥈 TheCryptoNexus (Hyperliquid): +$1.31M
🥉 Phantom Yak (Hyperliquid): +$1.24M
Shadow Wallaby led July with $1.98M in profit across 23 closed positions, executing 9.4k trades inside them, by far the heaviest intra-position scaling of the group. He won 73.9% of positions, but his average loss of about $380.8K ran roughly 1.5 times his average win of $250.7K, so the high hit rate carried the month, producing a profit factor of 1.87. His average profit-to-drawdown ratio of 0.70 was the lowest in the table: his positions sat through drawdowns comparable to the profits they booked. He held both sides long, winners about 5 days 15 hours and losers longer at 6 days 12 hours.
TheCryptoNexus finished second with $1.31M across 16 closed positions and 518 trades, the most discrete positioning of the three. He combined a 68.8% win rate with an average win of $126.2K against an average loss of $14.8K, a payoff ratio of about 8.5 that produced a profit factor of 18.71, the highest of the group. His risk-adjusted numbers led the table as well, with an average profit-to-drawdown ratio of 5.94. He held winners and losers alike for around 5 to 6 days.
Phantom Yak, featured for the second month in a row, generated $1.24M across 28 closed positions and 3.2k trades. He ran the lowest win rate of the three at 46.4%, but his average win of $143.1K came to roughly 3.4 times his average loss of $41.5K, giving him a profit factor of 2.99. The holding periods explain the asymmetry: he held winners about 9 days on average and cut losers in about 2 days 7 hours, a clear let-winners-run, cut-losers-fast profile.

Trader Spotlight: Shadow Wallaby#
Notional Exposure and PnL#
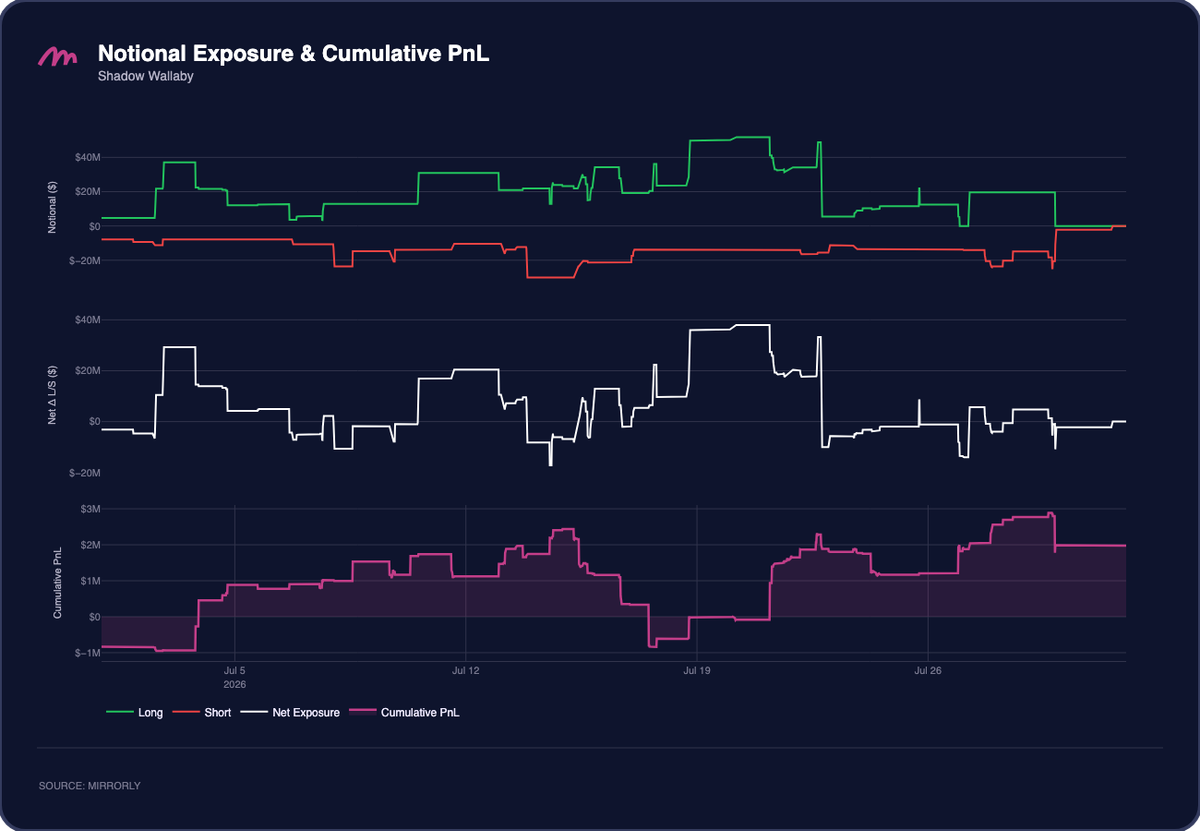
Shadow Wallaby ran a long/short book all month. His long notional cycled between roughly +$5M and +$40M, peaking near +$50M around July 19 to 21, against a steady short book mostly in the -$10M to -$25M range. Net exposure stayed positive for most of the month, oscillating between about -$10M and +$40M, with his largest net long stance coinciding with the late-July push in the majors.
His PnL path was the most volatile of the three. The curve opened the month near -$800K on positions carried in from late June, recovered above +$1M within the first days, and rose to about +$2.4M by July 13. A steep mid-month give-back followed, taking cumulative PnL to roughly -$700K around July 17 and 18, a round trip of about $3M that fits his low profit-to-drawdown ratio. He rebuilt through the second half, back to about +$2M by July 20, reaching a high near +$2.9M around July 29 before settling at roughly +$2M into month end.
Positions PnL by Symbol#
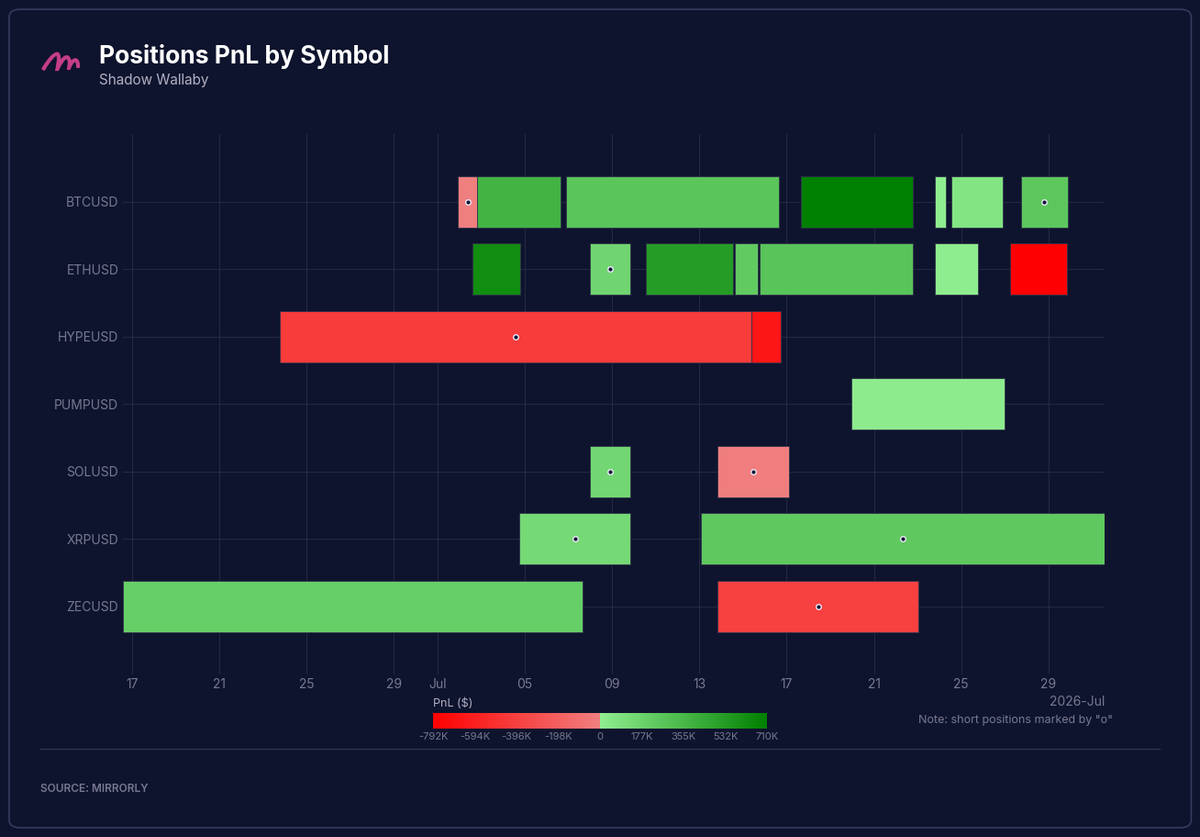
Shadow Wallaby traded seven symbols: $BTC, $ETH, $HYPE, $PUMP, $SOL, $XRP, and $ZEC. He stacked repeated $BTC and $ETH winners through the month alongside profitable $XRP shorts, while his standout loser was a $HYPE short carried from late June and closed around July 16, paying for the token's early-month strength and exiting just before its second-half breakdown. A $ZEC short in the July 14 to 22 window also finished red.
Total PnL by Symbol#
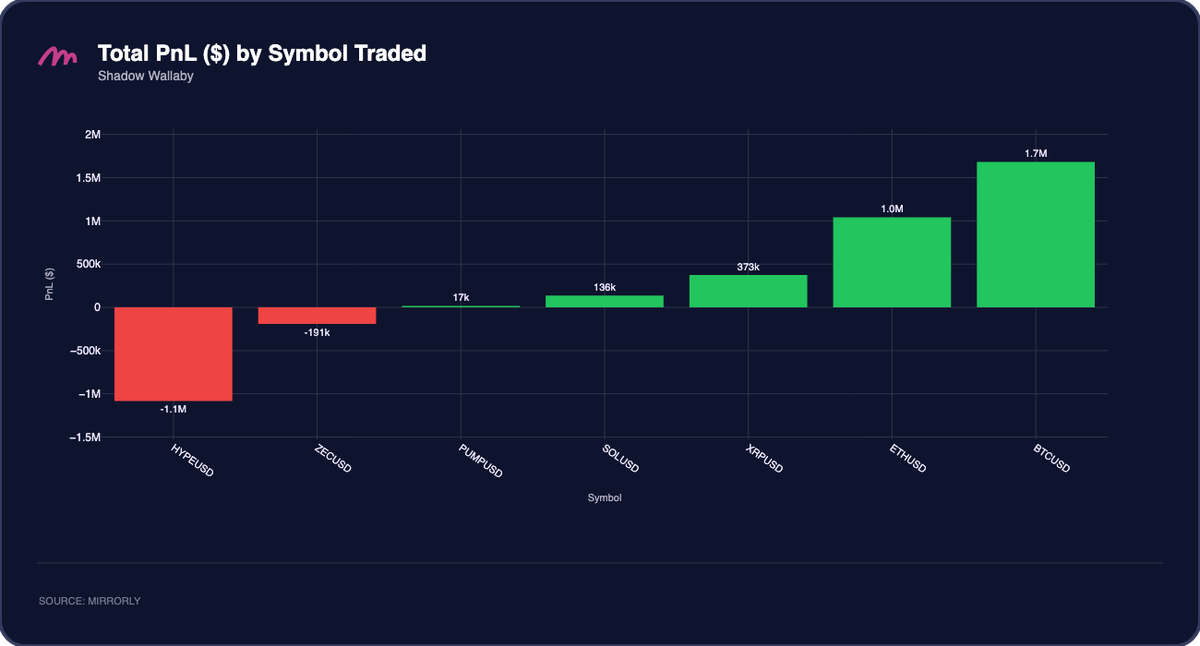
$BTC led at about +$1.7M, followed by $ETH at roughly +$1.0M. The two majors contributed around $2.7M, more than his entire monthly result. Smaller positives came from $XRP (+$373K), $SOL (+$136K), and $PUMP (+$17K). On the losing side, $ZEC cost about -$191K and $HYPE about -$1.1M, with that single carried $HYPE short absorbing roughly a third of his gross gains for the month.
PnL Distribution#
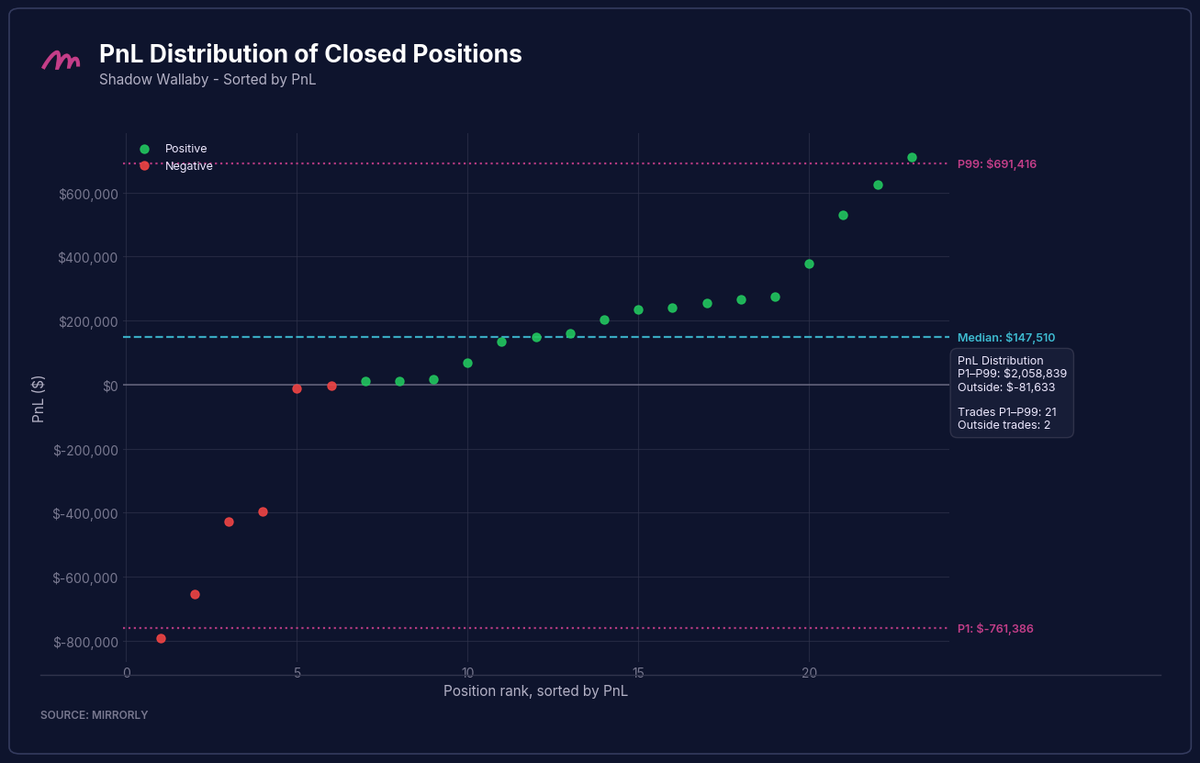
Shadow Wallaby's distribution stands out for its median: at +$147.5K, it is far above the near-breakeven medians typical of the traders featured in this report, with 17 of 23 positions closing positive. The 21 positions inside the P1 to P99 range (+$691K and -$761K) produced +$2.06M, while the two outside it netted -$82K, as his single largest loss near -$790K slightly outweighed his top winner near +$710K. The tails were roughly balanced, so breadth carried the month: a wide cluster of six-figure winners with half the book closing above +$147K.
Trader Spotlight: TheCryptoNexus#
Notional Exposure and PnL#
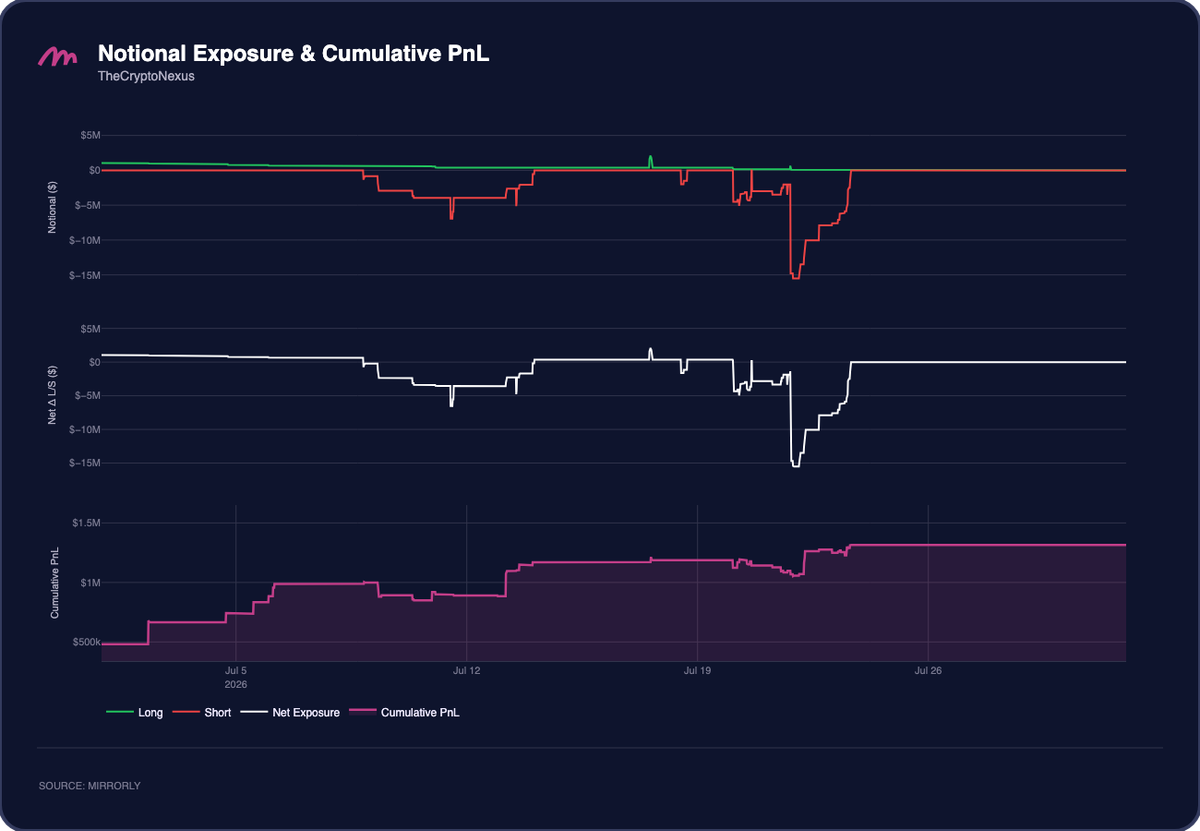
TheCryptoNexus was the least aggressive of the three in exposure terms. He held a small long book of about +$1M throughout, and expressed direction through short bursts: around -$5M on July 10 to 13, again on July 19 to 21, and a brief push to roughly -$15M on July 22 and 23 that he covered within days. Outside those windows his net exposure sat close to flat.
His cumulative PnL was a staircase. He opened July with roughly +$500K already accrued on a long-running $LIT position, stepped to about +$1M by July 8, reached roughly +$1.15M by July 12, then plateaued before a final leg to about +$1.31M after the late-July shorts. Drawdowns stayed shallow throughout, consistent with the best Sharpe ratio (0.38) and average profit-to-drawdown ratio (5.94) in the table.
Positions PnL by Symbol#
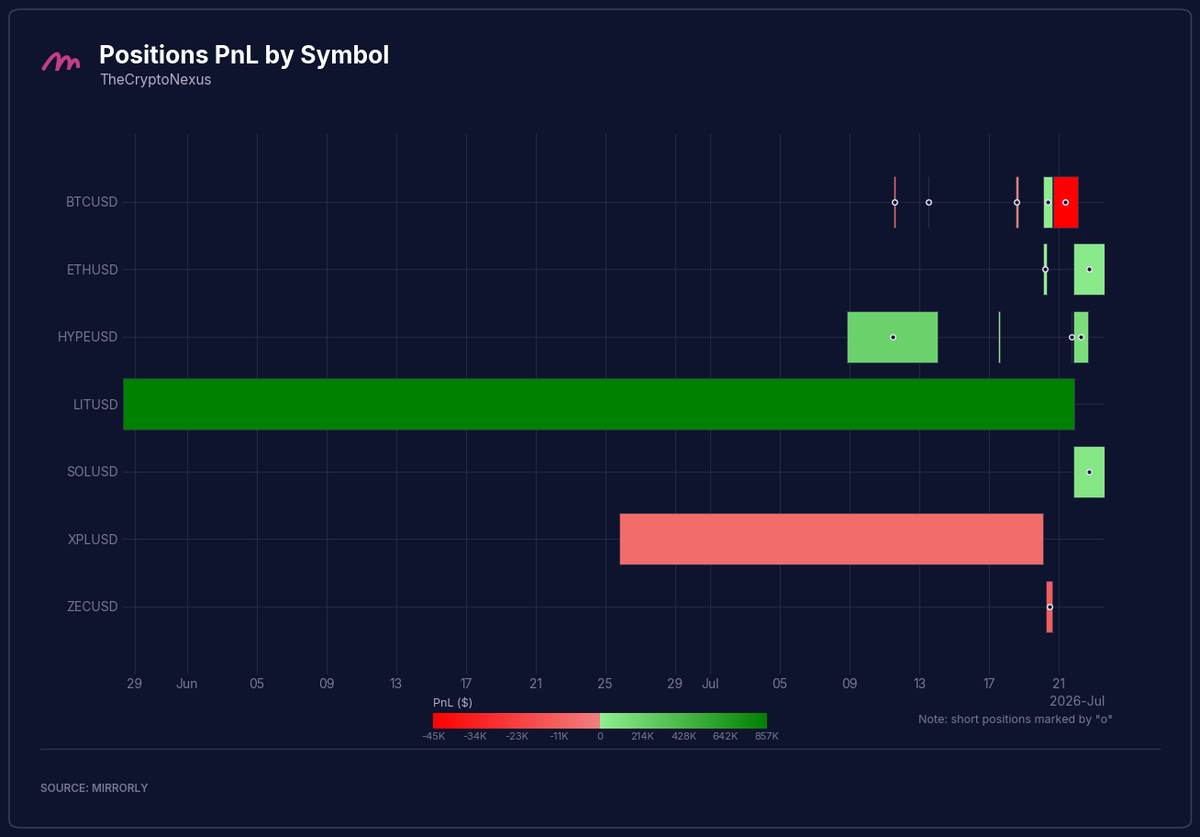
A single position defined TheCryptoNexus's month: a $LIT long opened in late May and held for nearly eight weeks until July 21, his largest winner. Around it he traded six other symbols ($BTC, $ETH, $HYPE, $SOL, $XPL, $ZEC), mostly in quick positions clustered in the second half of July; the only extended loser was an $XPL position held from late June to July 20.
Total PnL by Symbol#
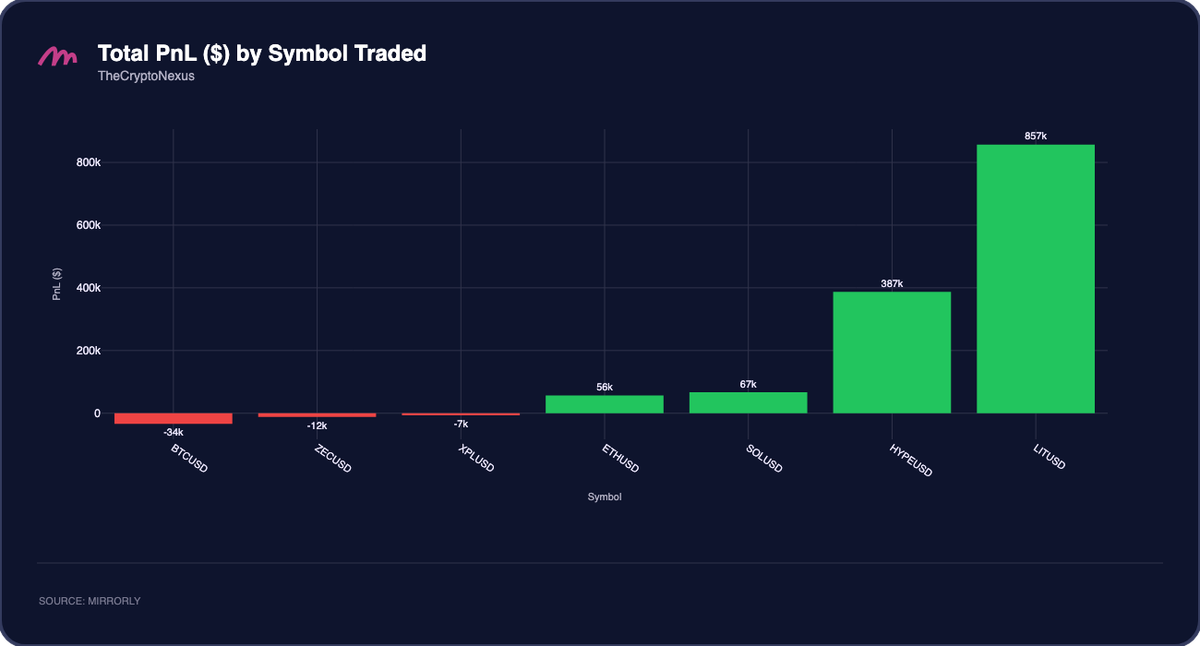
$LIT contributed about +$857K, roughly 65% of his monthly total on its own, followed by $HYPE at +$387K, $SOL at +$67K, and $ETH at +$56K. His losing symbols were negligible: $BTC (-$34K), $ZEC (-$12K), and $XPL (-$7K) combined for about -$53K against roughly $1.37M in gross gains.
PnL Distribution#
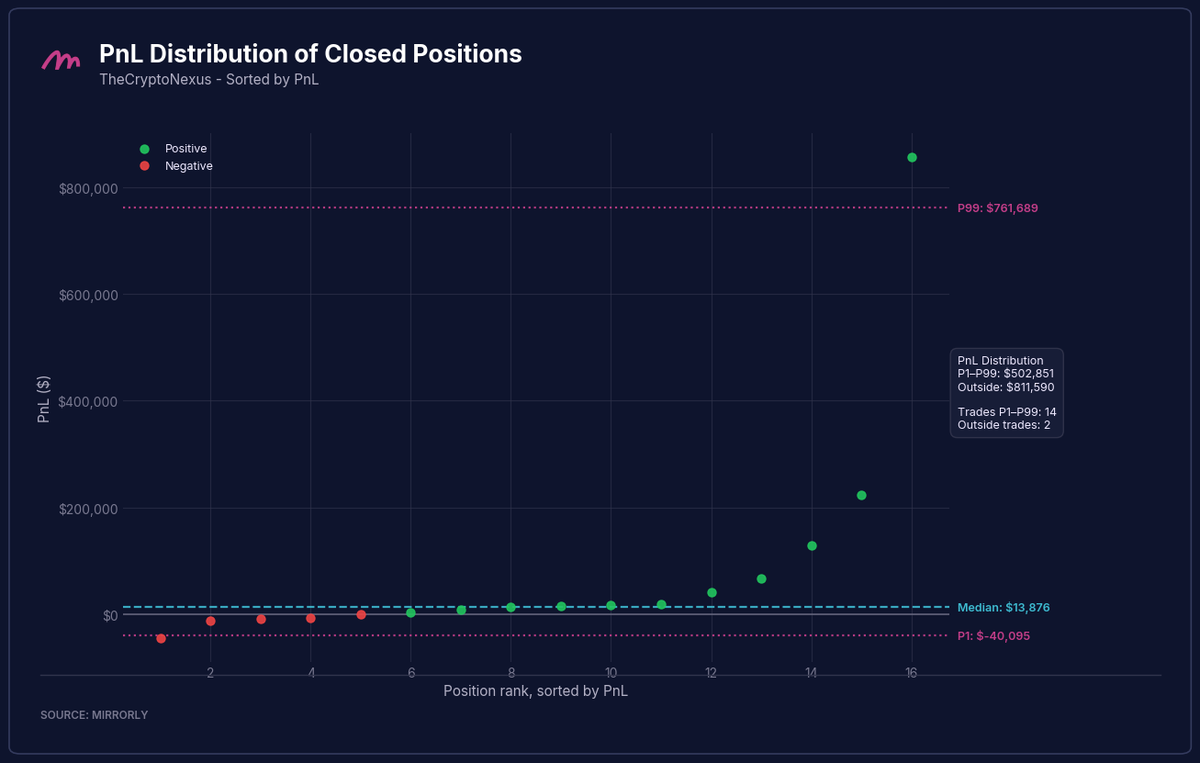
TheCryptoNexus showed the strongest positive skew of the group. His median closed position was +$13.9K, with 11 of 16 positions finishing green. The 14 positions inside the P1 to P99 range (+$762K and -$40K) produced +$503K, while the two outside it added +$812K, roughly 62% of his monthly total, dominated by the $LIT winner near +$860K. His largest loss was about -$45K, so his top winner ran close to 19 times his worst loss, the same asymmetry that shows up in his 18.71 profit factor.
Trader Spotlight: Phantom Yak#
Notional Exposure and PnL#
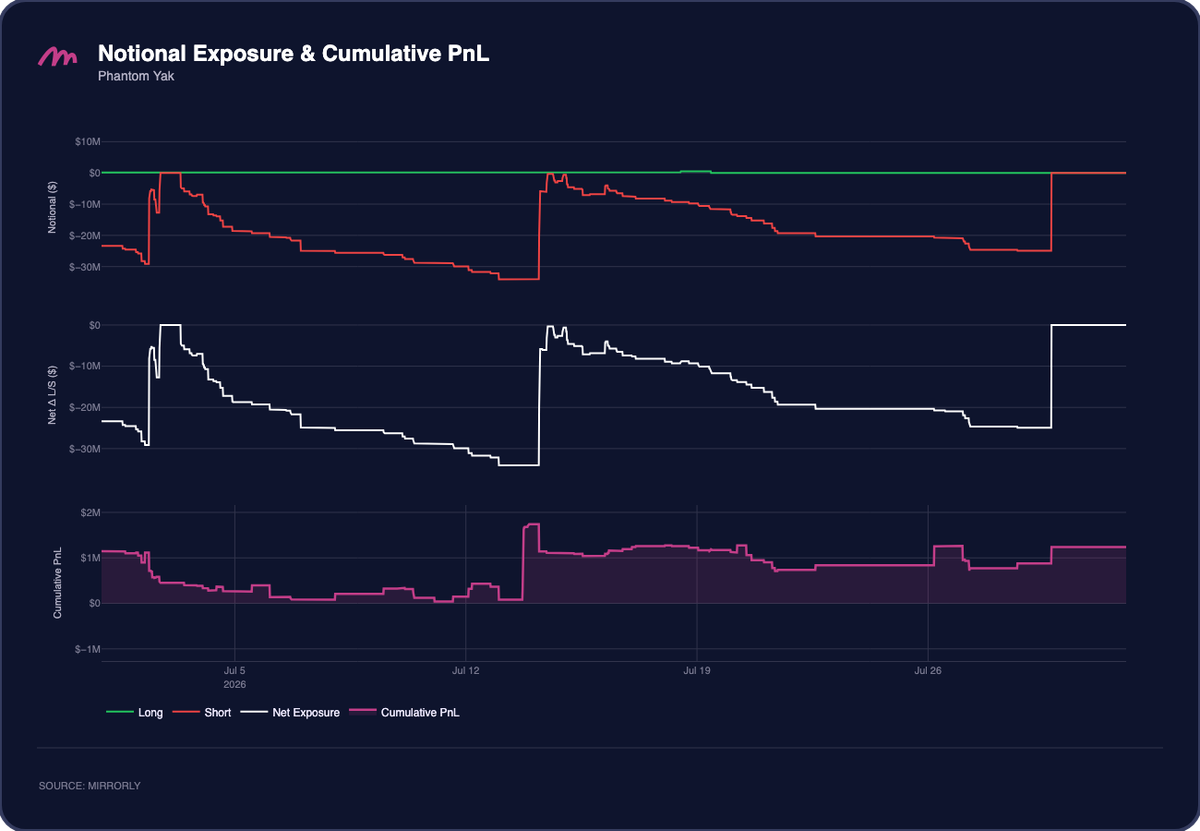
Phantom Yak ran a short-only book, with long exposure near zero all month. He entered July already about -$20M short on positions built in June and deepened the book to roughly -$33M by July 12, fighting the first-half rally: cumulative PnL faded from about +$1.1M at the open to near breakeven over the July 5 to 12 stretch.
The mid-month pullback paid his maximum-size book. He covered most of the shorts into the July 13 and 14 dip, taking exposure down to around -$5M, and cumulative PnL jumped to roughly +$1.7M. He then rebuilt shorts into the -$20M to -$25M range through the second half as $HYPE and $SOL weakened, closed the entire book at month end, and finished near +$1.2M.
Positions PnL by Symbol#
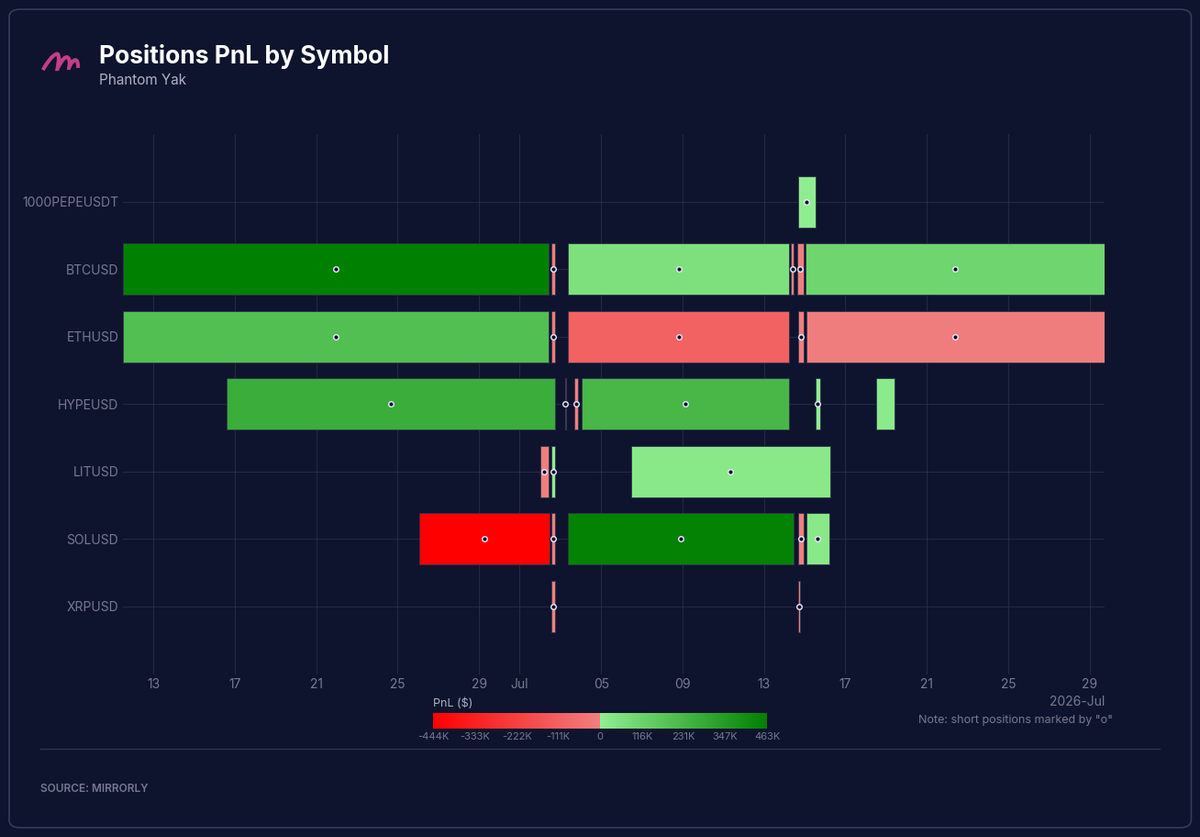
Every position Phantom Yak closed in July was a short, spread across $BTC, $ETH, $HYPE, $SOL, $LIT, $XRP, and $1000PEPE. All three of his $BTC shorts closed green, while $ETH paid in the position carried from June but lost in both second-half re-entries. On $SOL, a winning short from July 4 to 13 more than recovered the losing one he closed on July 2.
Total PnL by Symbol#
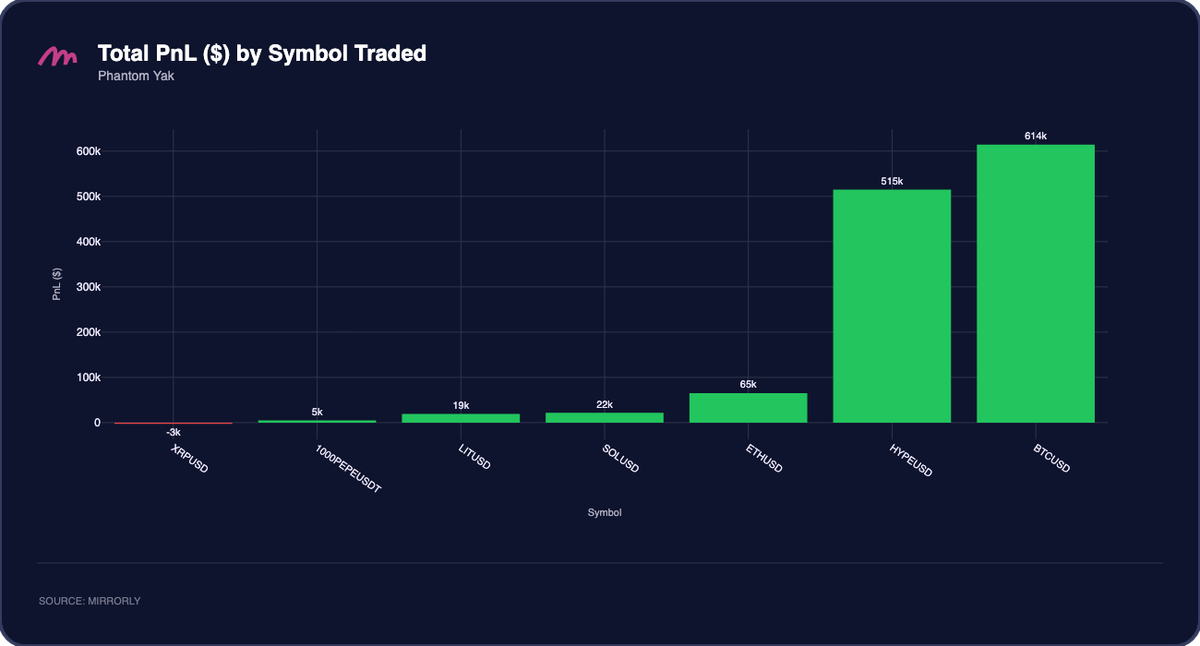
$BTC led at about +$614K, followed by $HYPE at roughly +$515K. Together they contributed around $1.13M, about 91% of his monthly total, with the $HYPE shorts aligned with the token's -16% month. Smaller positives came from $ETH (+$65K), $SOL (+$22K), $LIT (+$19K), and $1000PEPE (+$5K), and his only losing symbol was $XRP at about -$3K, leaving him profitable on six of seven symbols traded.
PnL Distribution#
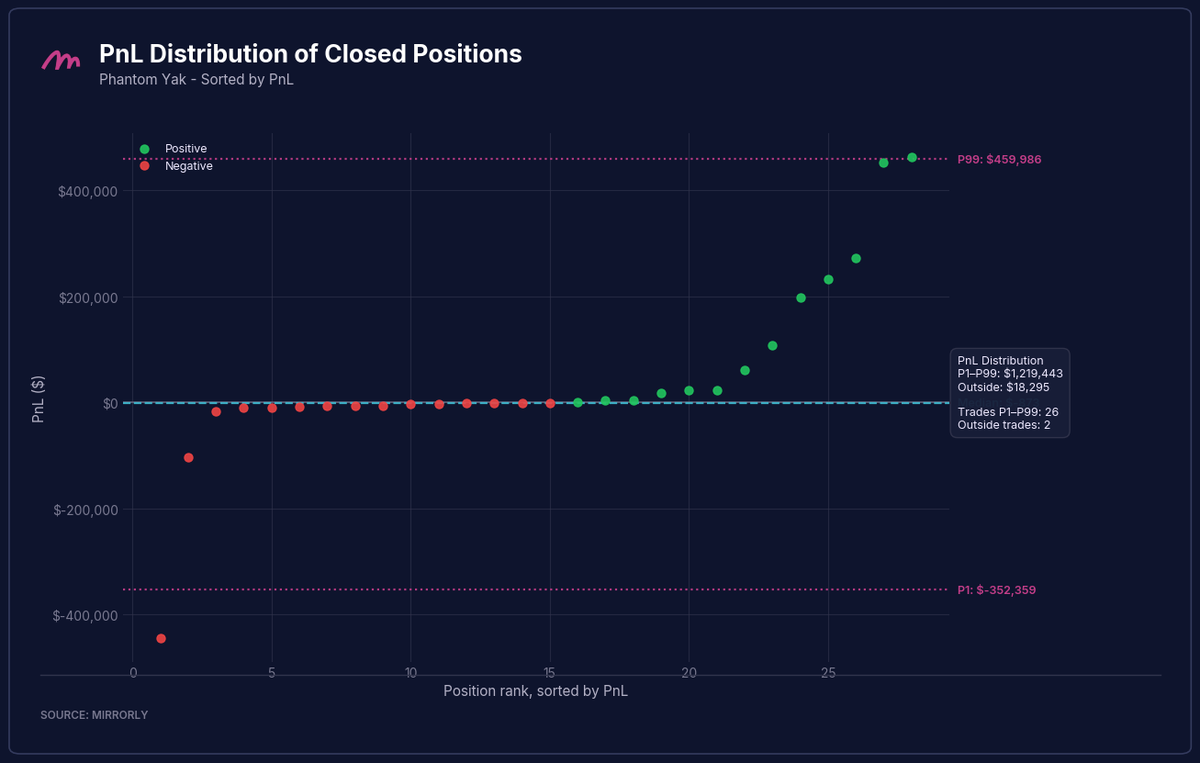
Phantom Yak's distribution matches his sub-50% win rate: 15 of 28 positions closed negative and his median sat essentially at breakeven. The downside stayed contained: all but two losses came in under $50K, one near -$100K and a single -$440K outlier, while the upside tail held five winners between roughly +$200K and +$460K. The 26 positions inside the P1 to P99 range (+$460K and -$352K) produced +$1.22M, and the two outside it netted just +$18K, as his top winner near +$458K offset the outlier loss. The shape reflects his holding discipline, losers cut in about 2 days against 9-day winners.
Case Study - Inside Phantom Yak's Probe-and-Scale Short Book#
Phantom Yak's spotlight showed the headline asymmetry: winners held about 9 days, losers cut in just over 2. His 28 closed July positions split into two groups that explain how. Fifteen were probes, starter shorts of roughly $200K to $1M that he never scaled beyond $2M; they netted about +$11K combined, with every loss under $8K. The other thirteen were positions he scaled to between $2M and $14M peak notional, and they produced +$1.23M of his +$1.24M month. The median scaled position peaked at 7 times its starting size, and he placed 53% of his 272 adds in them while the position was underwater.
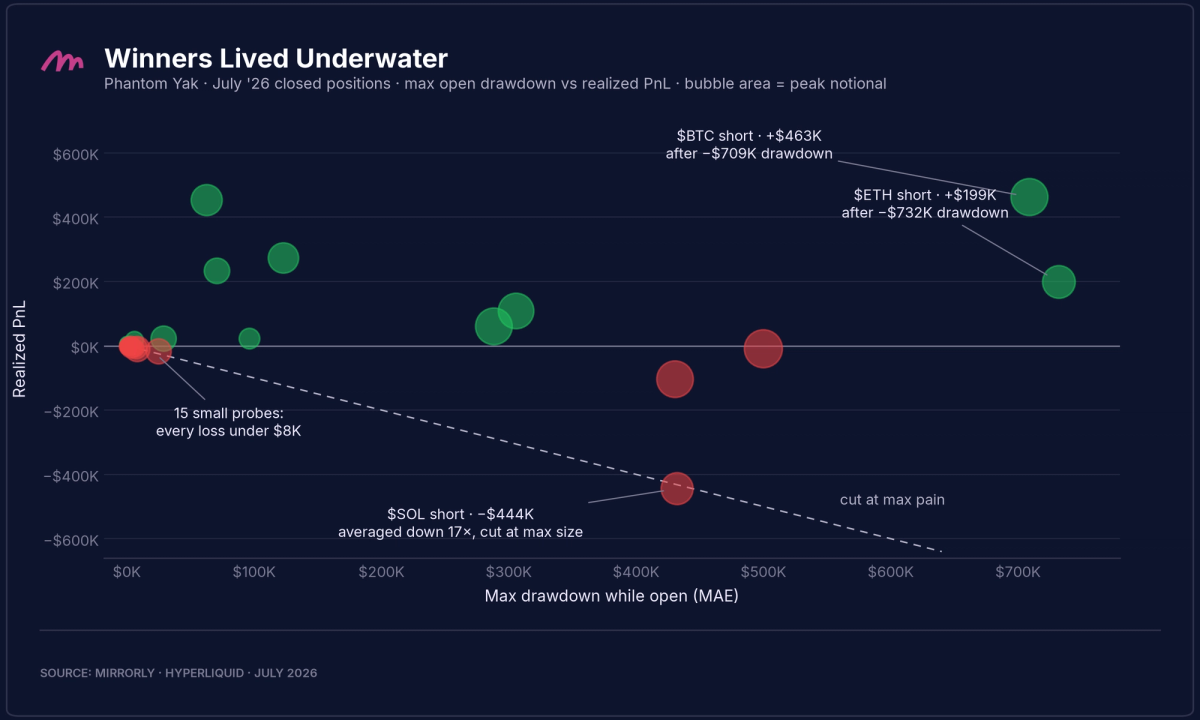
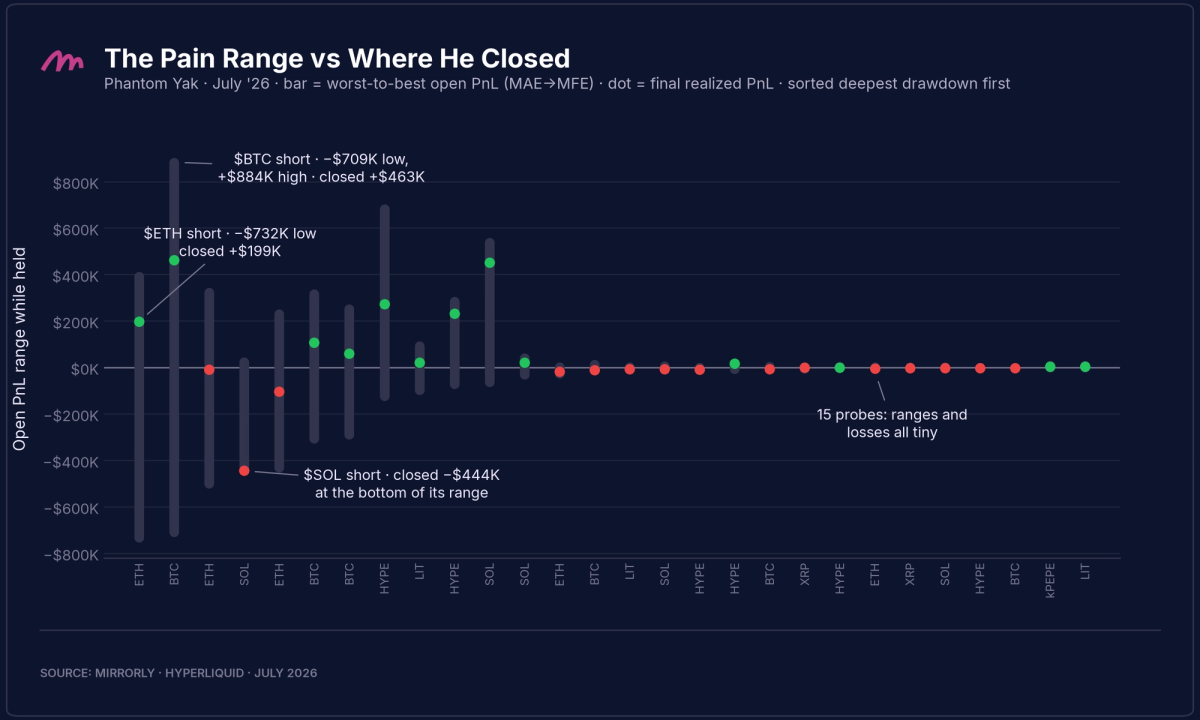
The chart below shows what those scaled positions lived through. Each bar spans a position's worst-to-best open PnL while held, and the dot marks where it closed. He sat through a median open drawdown of about -$288K on his seven six-figure winners, the deepest at -$732K on an $ETH short that finished +$199K. The contained losses in his spotlight come from holding through drawdowns rather than stopping out: he adds while underwater, waits for the book to recover, and closes in the upper half of the range, capturing a median of roughly 45% of a position's peak open profit. One dot sits at the bottom of its bar, and that position is the counterexample.
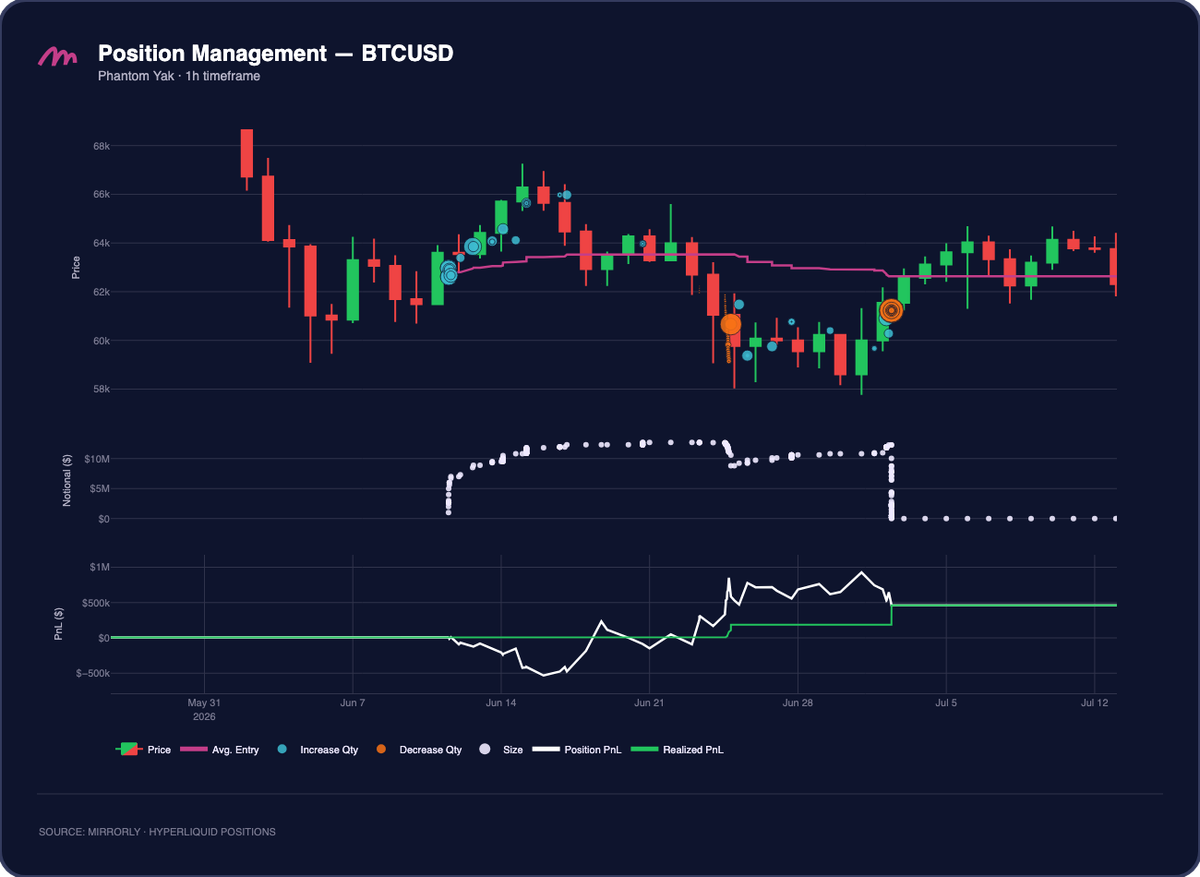
His biggest winner shows the pattern working. Phantom Yak opened a $BTC short on June 11 at an average entry near $62.6K and scaled it from about $2M to a peak of $12.7M notional across 24 adds, 13 of them while the position was losing. By June 15 the position was roughly -$709K underwater as price pushed toward $66K. He held, covered part of the book into the June 24 dip near $61K to bank around $300K, and closed the remainder on July 2 for a total of +$463K, about half of the +$884K peak open profit the position had reached the day before.
The $SOL short that closed on July 2 is the same playbook without the rescue. He opened it on June 26 in the high $60s and added 17 times, all of them underwater, as $SOL rallied toward $80. The adds lifted his average entry from around $70 to $74.90, but notional grew from $576K to $6.8M, so he reached maximum size at maximum pain and cut the entire position near $80 for -$444K, his largest loss of the month and the outlier in his PnL distribution. He re-entered a fresh $SOL short the following day, and the new position finished +$453K, recovering the loss in full.
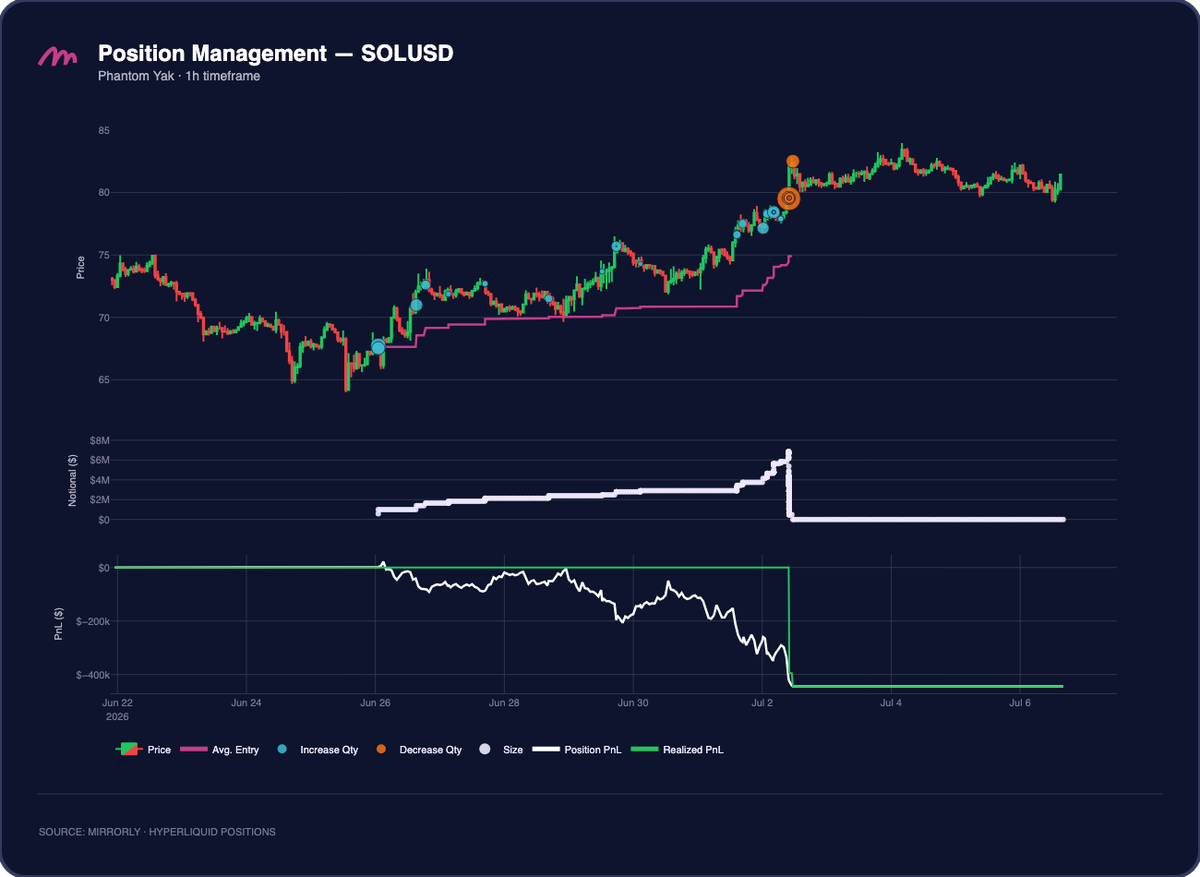
For copy traders, the split between his two scaling modes is the lesson. The scaled positions where he mostly added into profit produced about +$1.16M net, including his three cleanest winners. The ones where he mostly averaged down finished near flat at +$88K net and include the single large tail loss. Copying this profile means accepting stretches of small quick losses and deep open drawdowns that usually recover. The $SOL trade shows the cost when one does not.
Conclusion#
July's selective tape produced three different routes to the top of the leaderboard. Shadow Wallaby traded both sides of the majors, absorbed a mid-month round trip of roughly $3M, and still finished first at +$1.98M. TheCryptoNexus sidestepped most of the volatility, converting one patient $LIT carry into 65% of his +$1.31M with the shallowest drawdowns of the group. Phantom Yak monetized the weak side of the market with a short-only book, drawing 91% of his +$1.24M from $BTC and $HYPE.
The case study shows how much risk a headline stat can hide. Phantom Yak's clean loss distribution rests on sitting through six-figure open drawdowns inside scaled positions. Copying him means living that path, whatever the month-end number turns out to be.
Join Mirrorly: https://portal.mirrorly.xyz/#
Subscribe to our Notifications so you don't miss next month's report!