
Top Traders Report - October '26#
Introduction#
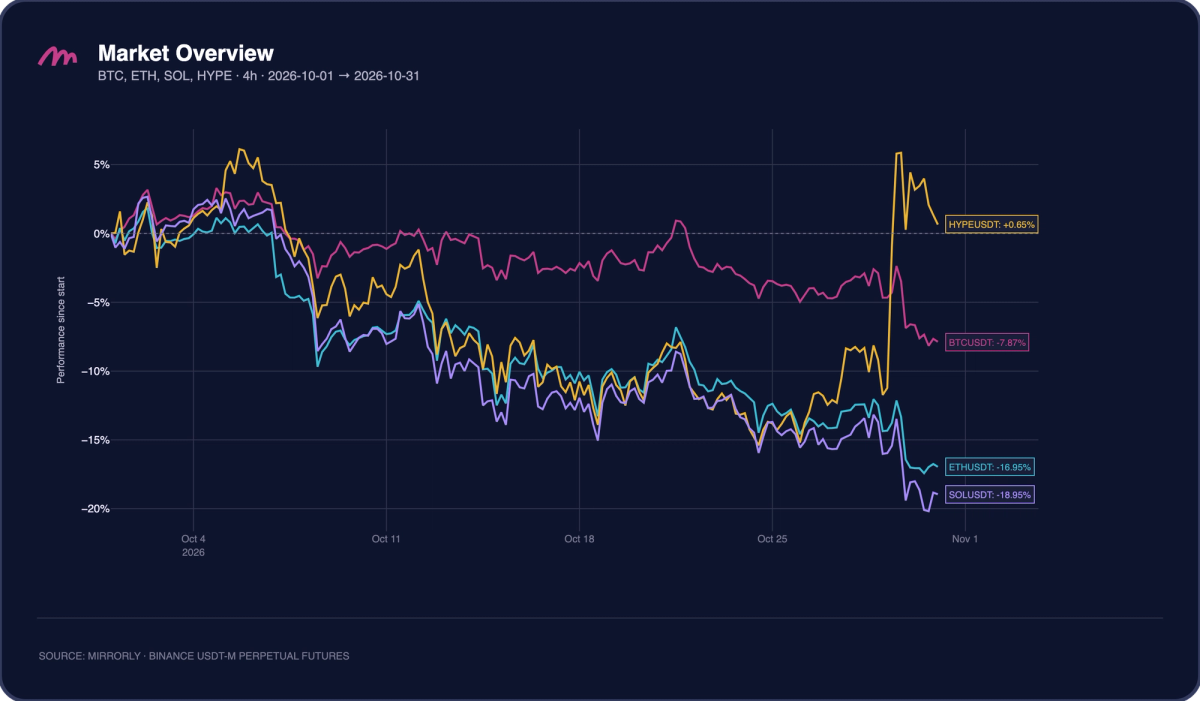
October reversed September's rally. The four benchmarks rose together through the first week, with $HYPE up about +6% on October 5 and $BTC, $ETH, and $SOL up 1% to 3%. The selloff began on October 6 and 7. By October 9, $ETH was down about 9%, $SOL about 8%, and $HYPE about 6%, while $BTC held near -3%. $ETH, $SOL, and $HYPE kept falling in steps and reached roughly -15% around October 18 and again on October 24 and 25. $BTC was the most resilient of the group, trading between -5% and flat for most of the month and returning above zero for a short time around October 21.
The final days split the group again. On October 29 $HYPE rallied from about -11% to roughly +6%, and it closed the month up about +0.65%, the only benchmark to finish positive. $BTC, $ETH, and $SOL fell over the same days and closed at about -7.9%, -17.0%, and -19.0%. Short and flat books came out ahead. A long in $ETH or $SOL held all month lost 17% to 19%.
This month Mirrorly’s top 3 traders are:
🏆 RTB2 (Hyperliquid): +$1.47M
🥈 Cool Russell (Hyperliquid): +$1.26M
🥉 Crystal Tasmanian (Hyperliquid): +$505K
RTB2 led October with $1.47M in profit across only 8 closed positions and 793 trades. This is his first monthly report, after reaching the top ten in both the Q2 and Q3 Quarterly Insights. Seven of the eight positions closed green, an 87.5% win rate, and his average win of $220.3K was about three times his only loss of $74.1K. With a single small loss against large winners, his profit factor reached 20.81 and his average profit-to-drawdown ratio 8.73, both the highest in the table. Like the other two, he held his one loser longer than his winners: about 12 days, against 5 days 10 hours.
Cool Russell finished second with $1.26M across 286 closed positions and 80.4k trades, the most active of the three. He returns after the February and March reports, where he was also the most active trader, and this is his largest result of the three ($1.01M in February, $586K in March). He won 59.1% of his positions with a profit factor of 2.11. His payoff ratio changed the most: in February and March his average loss exceeded his average win, while in October his average win of $14.2K was about 1.5 times his average loss of $9.7K. His average PnL per position rose to about $4.4K, from roughly $2.0K in February and $1.2K in March. His average profit-to-drawdown ratio of 0.76 was the lowest in the table, and he held both winners (about 15 hours 40 minutes) and losers (about 17 hours 33 minutes) for less than a day.
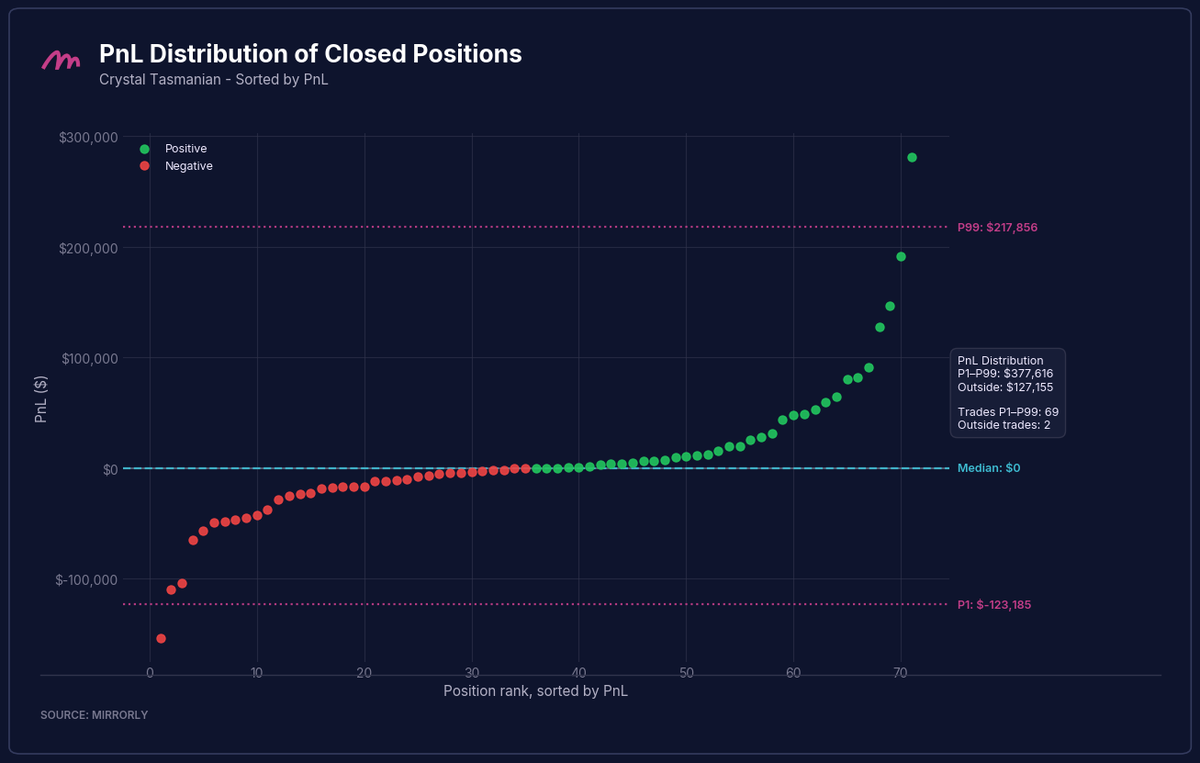
Crystal Tasmanian, featured in May, June, and August, makes his fourth monthly report of the year with $505K across 71 closed positions and 379 trades. That is more than double the positions he closed in any of his earlier appearances (21 in May, 34 in June, and 27 in August). His win rate of 50.7% was the lowest of the three, and his average win of $42.6K was about 1.45 times his average loss of $29.4K, giving a profit factor of 1.49. His average profit-to-drawdown ratio was 1.56. He held positions for the shortest time in the group, with winners held about 5 hours and losers about 11 hours, more than twice as long.

Trader Spotlight: RTB2#
Notional Exposure and PnL#
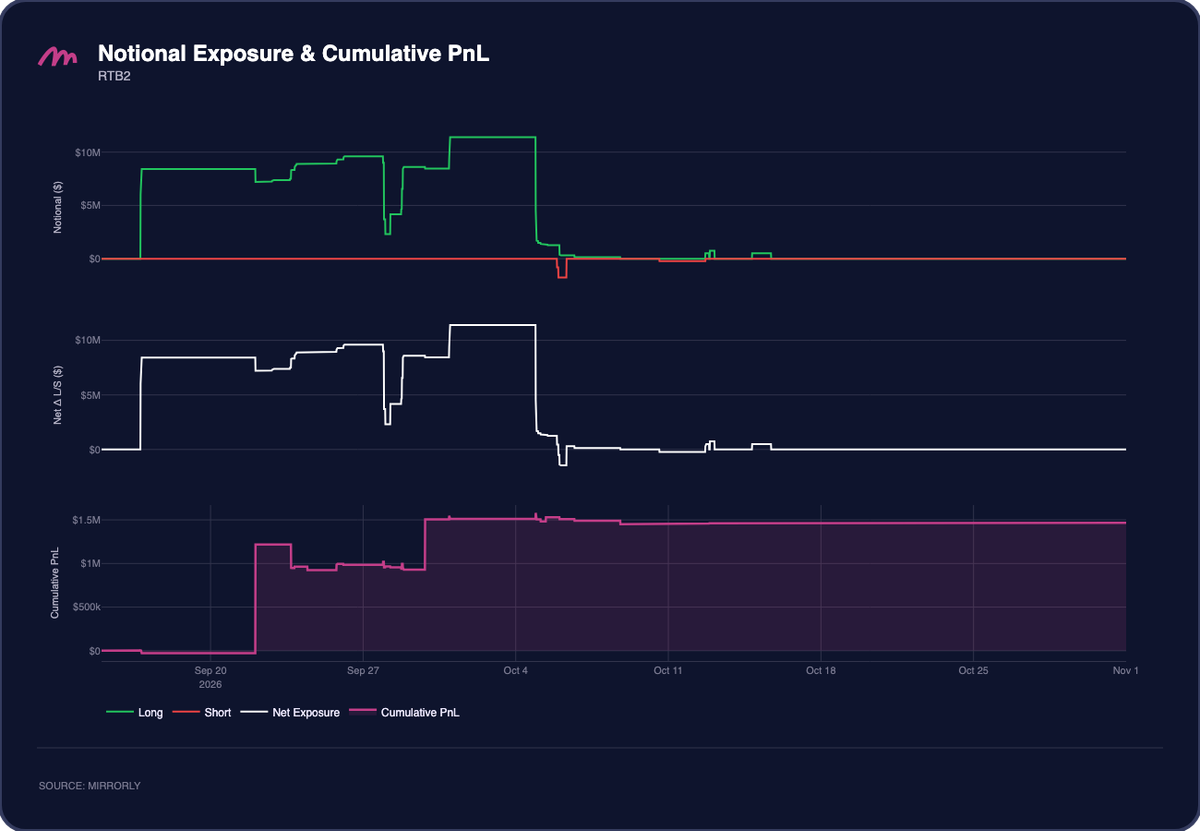
RTB2 made his October result with long positions he opened in the second half of September. He went long around September 16 and 17 with roughly +$8.5M of notional, added in steps to about +$9.6M by September 27, cut the book to about +$2.3M for a day on September 28, and rebuilt it to a peak near +$11.5M around September 30. The short side stayed empty. On October 5 he closed almost the entire book, cutting exposure to about +$1.5M, a day before the majors began to fall. After a short of about -$1.5M on October 6, he closed only small positions through October 15 and none after that.
He booked most of the result before October. His cumulative PnL curve, which includes the gains he realized as he reduced positions, stepped from roughly zero to about +$1.2M on September 22, eased to about $930K over the following week, and stepped again to about +$1.5M on September 30. In October it moved little, peaking near $1.55M on October 5, drifting to about $1.46M by October 9, and staying there to finish at +$1.47M.
Positions PnL by Symbol#
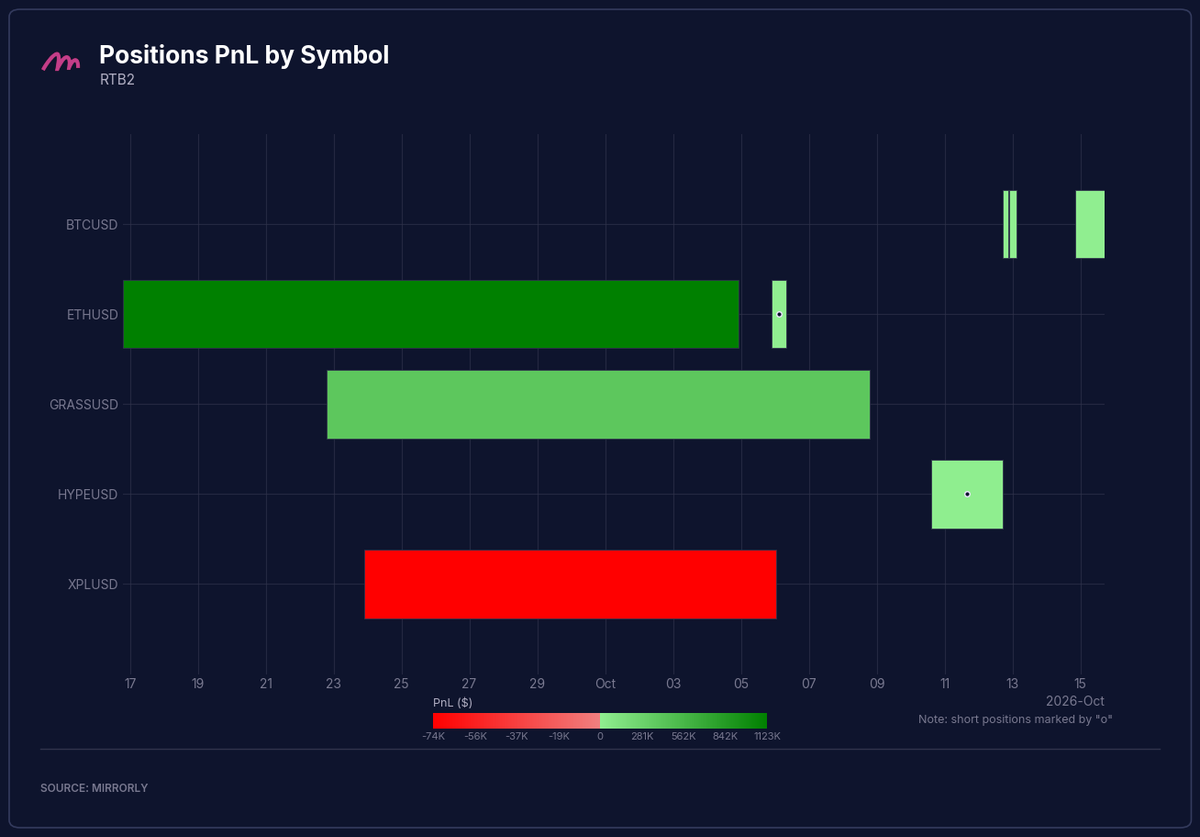
RTB2 traded five symbols: $BTC, $ETH, $GRASS, $HYPE, and $XPL. Three long holds he opened in September made up the month: an $ETH long held from about September 17 to October 5, his largest winner, a $GRASS long from September 23 to October 9, and an $XPL long from September 24 to October 6, his only loss. The rest were brief positions, an $ETH short on October 6, a $HYPE short from October 10 to 12, and three $BTC longs between October 12 and 16.
Total PnL by Symbol#
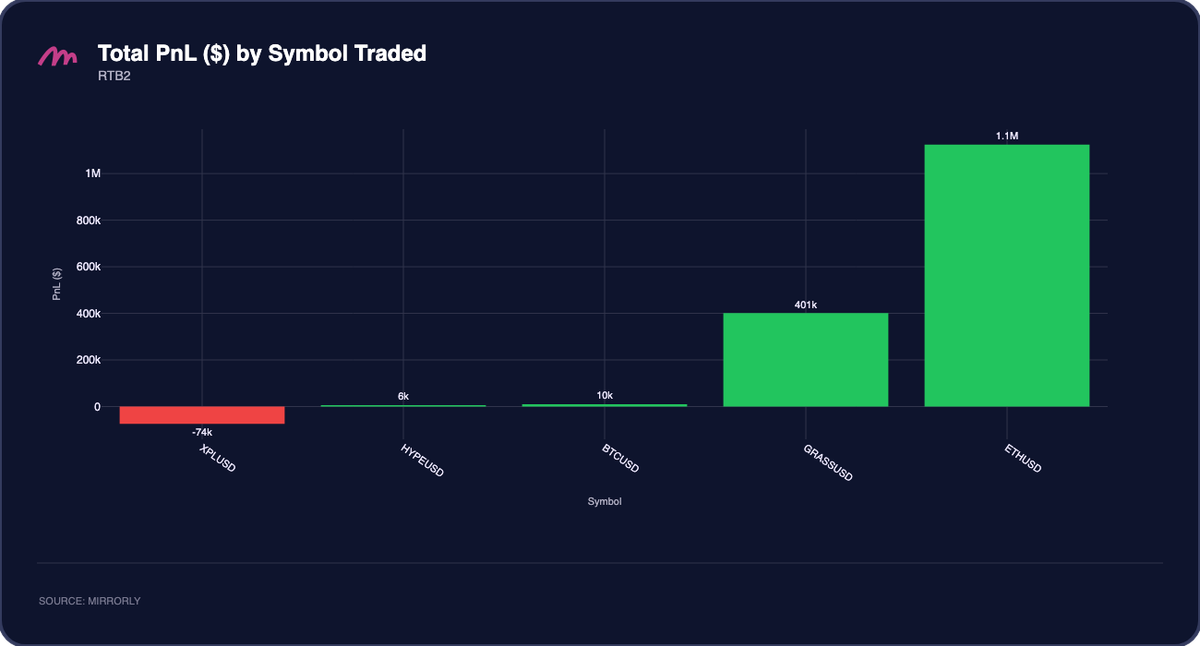
$ETH contributed about +$1.1M, roughly three quarters of the monthly total, and $GRASS added +$401K. Together they made about 104% of the full result. $BTC (+$10K) and $HYPE (+$6K) were close to flat, and $XPL was the only losing symbol at -$74K, about 5% of gross gains.
PnL Distribution#
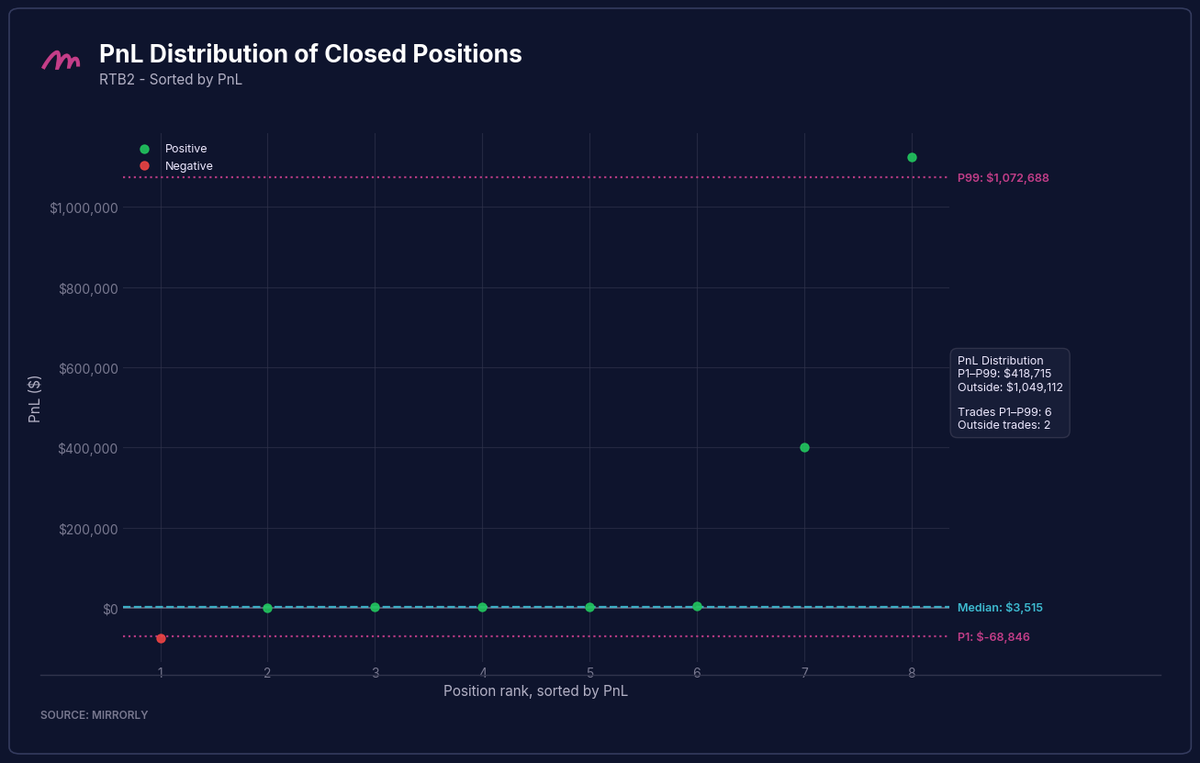
With eight closed positions, RTB2's distribution is the most concentrated of the three. The median was +$3.5K, and five of the seven winners, the $ETH and $HYPE shorts and the three $BTC longs, were small. The six positions inside the P1 to P99 range (+$1.07M and -$69K) produced +$419K, almost all of it from the $GRASS long. The two outside the range netted +$1.05M, about 71% of the monthly total: the $ETH long near +$1.12M and the $XPL loss of about -$74K. The top winner was roughly 15 times the only loss.
Trader Spotlight: Cool Russell#
Notional Exposure and PnL#
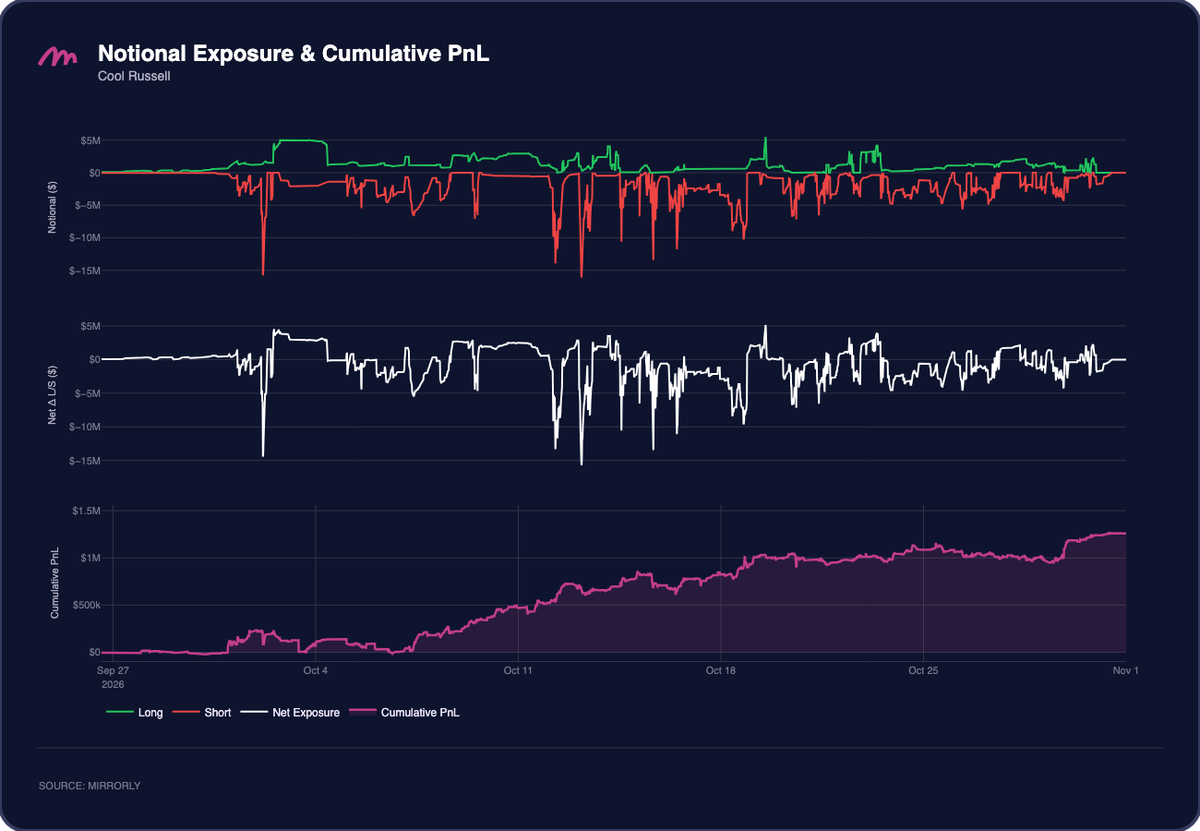
As in his earlier reports, Cool Russell ran a two-sided book that leaned short. Short notional sat between -$2M and -$5M, with frequent bursts to -$10M and beyond, the largest near -$15M on October 2 and again on October 12 and 13. The long side was smaller, mostly under +$2M, with a block near +$5M held from about October 2 to 4. Net exposure moved between roughly +$5M and -$15M and stayed net short for most of the month, in line with the falling market.
His PnL curve shows the steadiest accumulation of the three. After an early gain to about +$230K on October 2 that faded back to roughly zero by October 7, the curve rose with few pauses, reaching about +$500K by October 11 and +$1M by October 19. It moved sideways between about $950K and $1.1M for the next ten days, then stepped up around October 30 as the majors fell, finishing at +$1.26M. After October 7, his largest pullback was about $200K.
Positions PnL by Symbol#
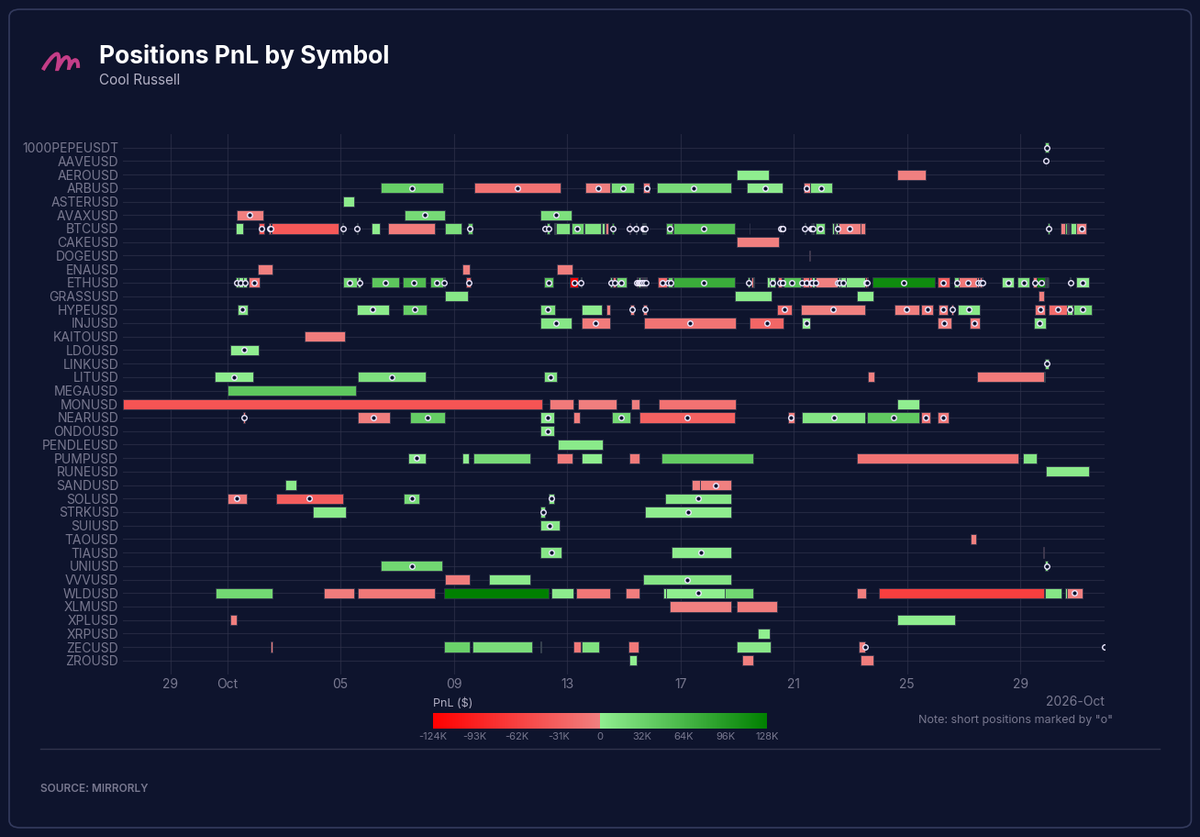
Cool Russell traded the broadest set of the three, closing positions across 39 symbols. Most of his $BTC and $ETH positions were shorts. His altcoin positions split about evenly between the two sides: $WLD, $ZEC, and $PUMP made their money as longs, $NEAR and $ARB as shorts. His longest hold was a losing $MON long carried from late September to October 12.
Total PnL by Symbol#
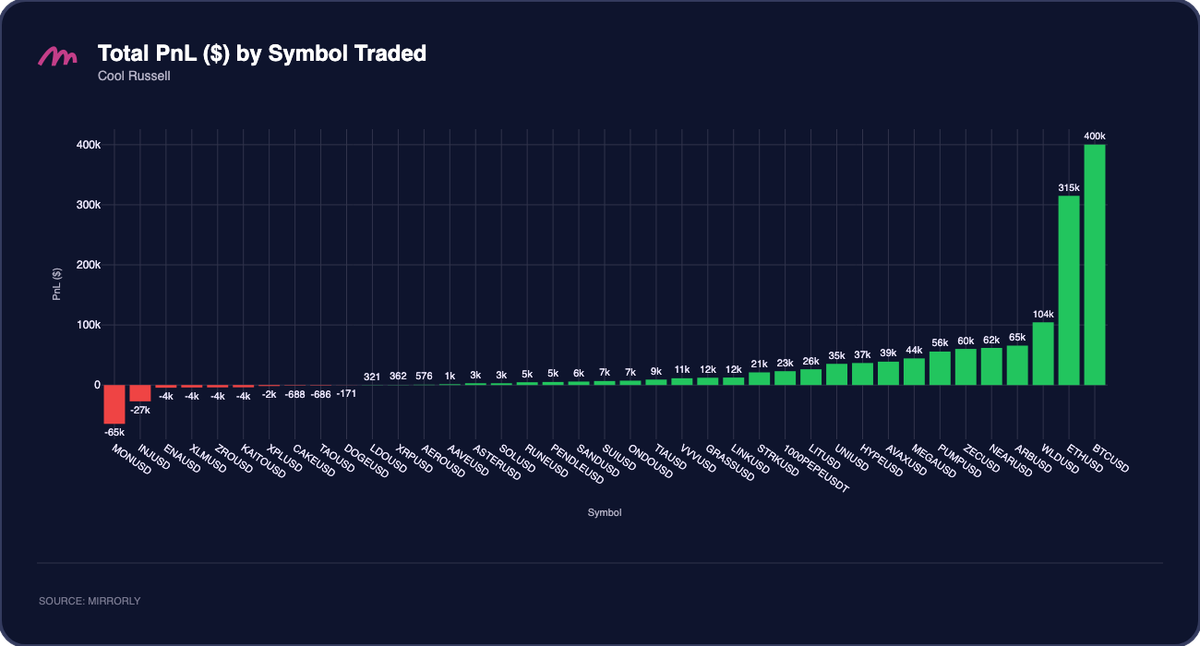
$BTC led at about +$400K, followed by $ETH at +$315K. Together they contributed about 57% of the monthly total, consistent with his short bias in the majors. $WLD (+$104K), $ARB (+$65K), $NEAR (+$62K), $ZEC (+$60K), and $PUMP (+$56K) added another $347K. He spread his losses thin: ten symbols finished red, led by $MON at -$65K and $INJ at -$27K, and combined losses of about $112K absorbed roughly 8% of gross gains.
PnL Distribution#
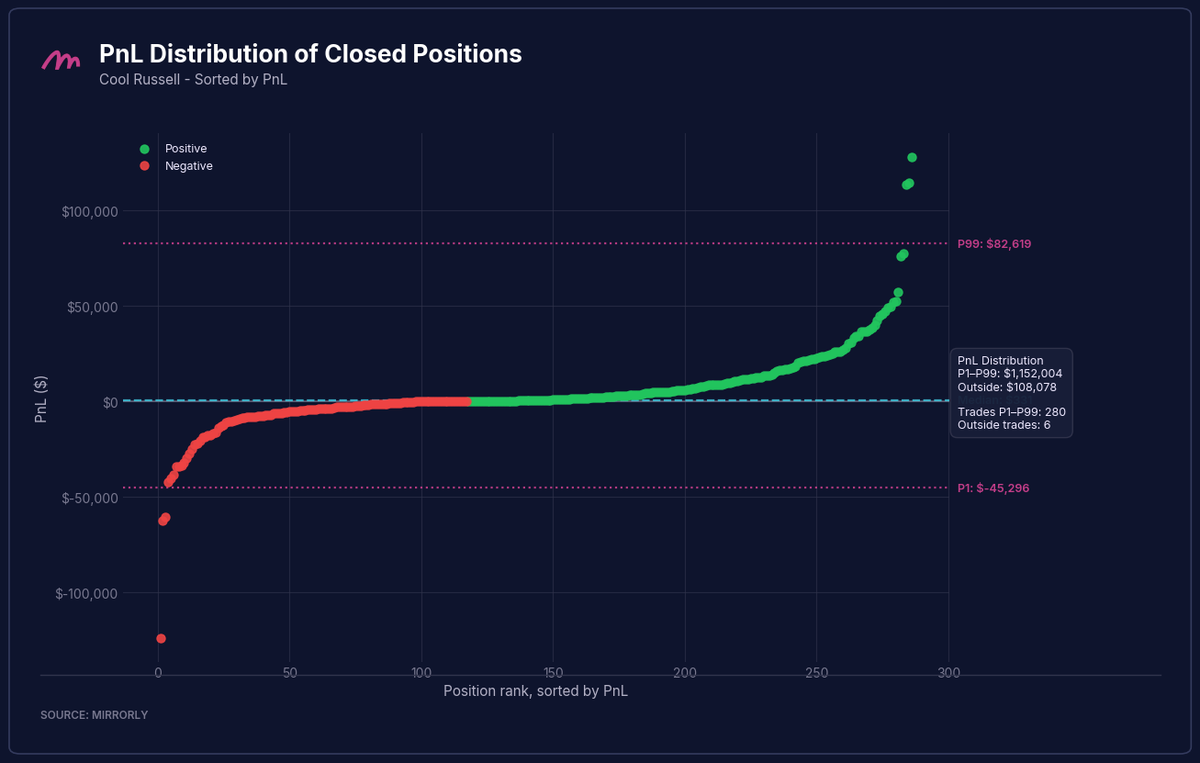
Cool Russell's distribution is flat through the middle and spread at the tails. The median sat close to zero, with most positions closing within about ±$10K. The 280 positions inside the P1 to P99 range (+$82.6K and -$45.3K) produced +$1.15M, about 91% of the monthly total, while the six outside it netted only +$108K. The extremes were close to symmetric: his three largest winners, between about +$114K and +$128K, sat against a worst loss near -$124K and two more near -$61K. His edge came from just inside the tails, where about twice as many positions closed above +$20K as below -$20K.
Trader Spotlight: Crystal Tasmanian#
Notional Exposure and PnL#
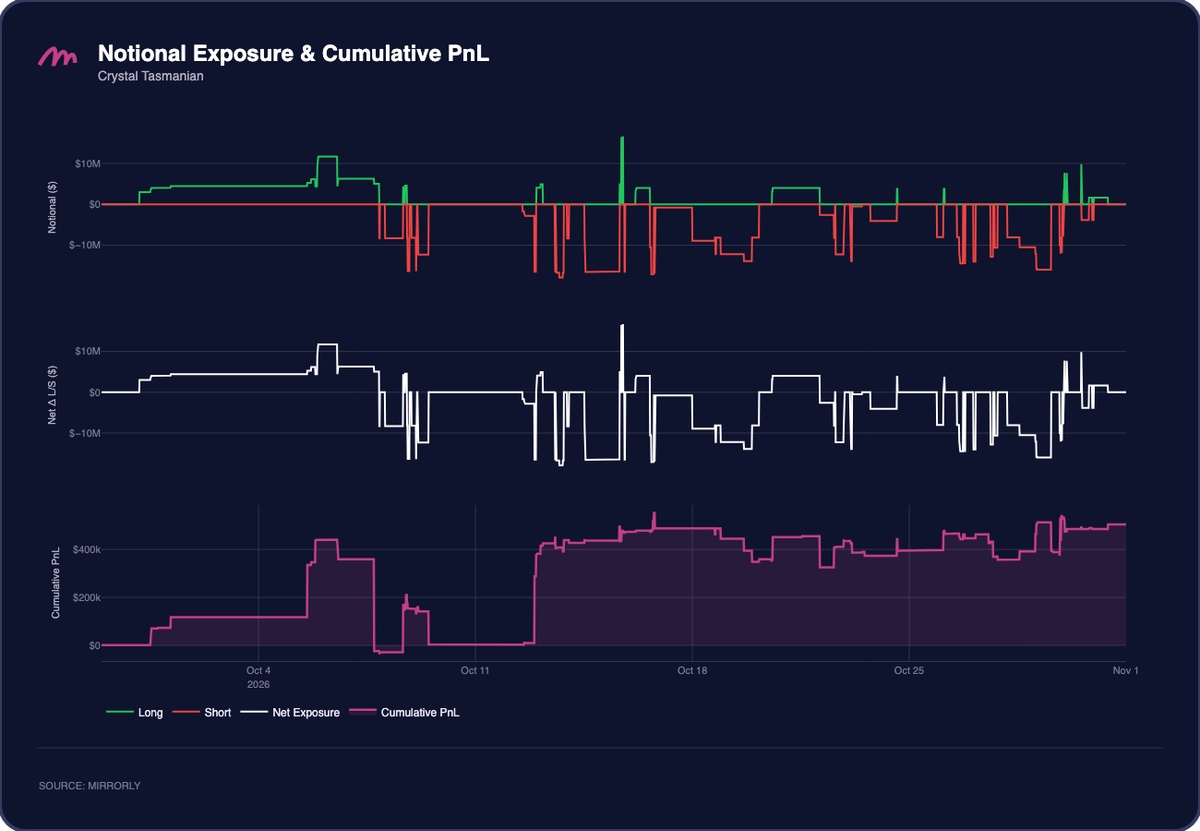
Crystal Tasmanian started October with the long-biased book seen in his earlier reports and finished it as a mostly short trader. Through the first week he held a long of about +$3M to +$4.5M, which he raised to roughly +$12M on October 6. From October 8 he traded short. Short notional ran between about -$8M and -$17M in discrete blocks, with net exposure between zero and -$17M most of the time. Long exposure after that point was brief, the largest a short-lived +$17M on October 15 and a +$4M hold from October 20 to 22.
The PnL curve was volatile in the first half. It rose to about +$440K by October 6, then gave all of it back by October 8, dipping to roughly -$25K. After a brief recovery it sat near zero again from October 9 to 12. On October 12 and 13 the curve jumped to about +$430K, most of it from a single $NEAR short. It peaked near +$550K on October 16, then moved between about $330K and $520K for the rest of the month before finishing at +$505K.
Positions PnL by Symbol#
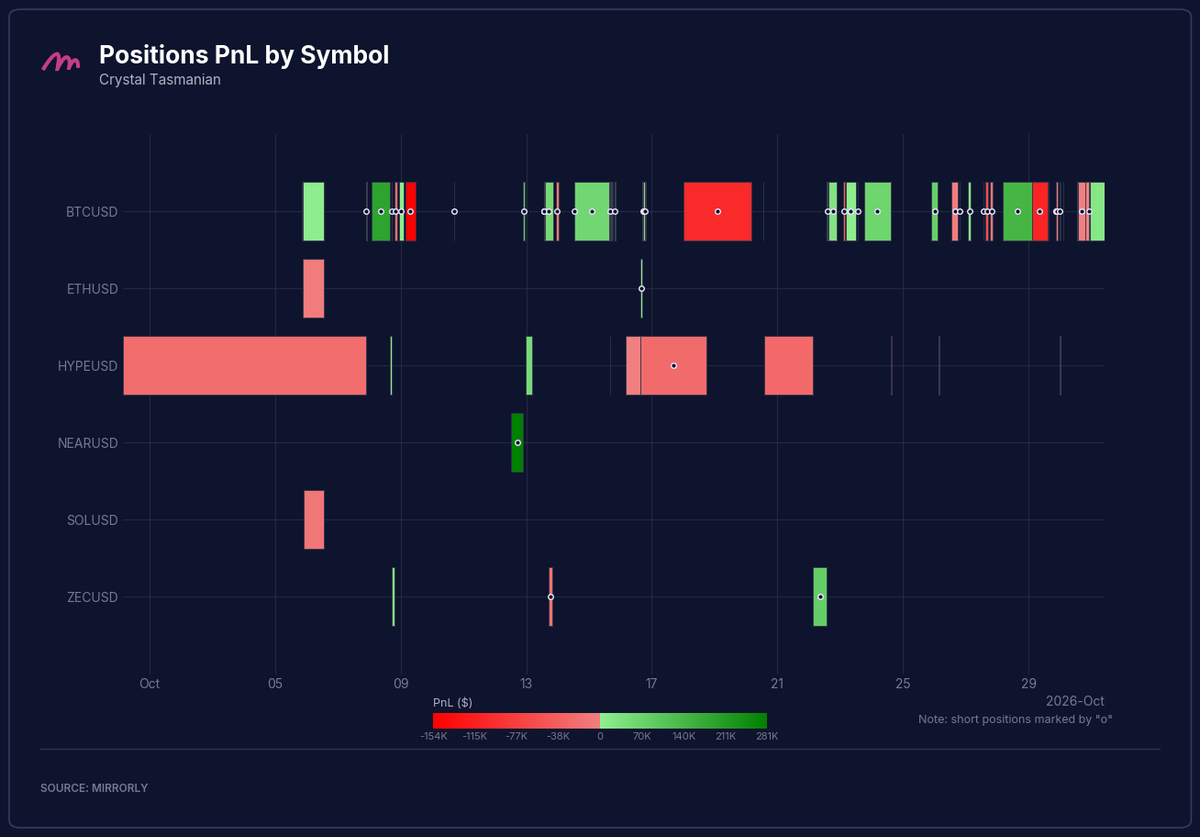
Crystal Tasmanian traded six symbols and did most of his trading in $BTC, almost all of it short. His largest winner was a $NEAR short held for less than a day on October 12 and 13, while his largest loss was a $BTC short held from about October 18 to 20. $HYPE was his weakest symbol, with a long carried from late September to October 8 and later positions on both sides that all closed red.
Total PnL by Symbol#
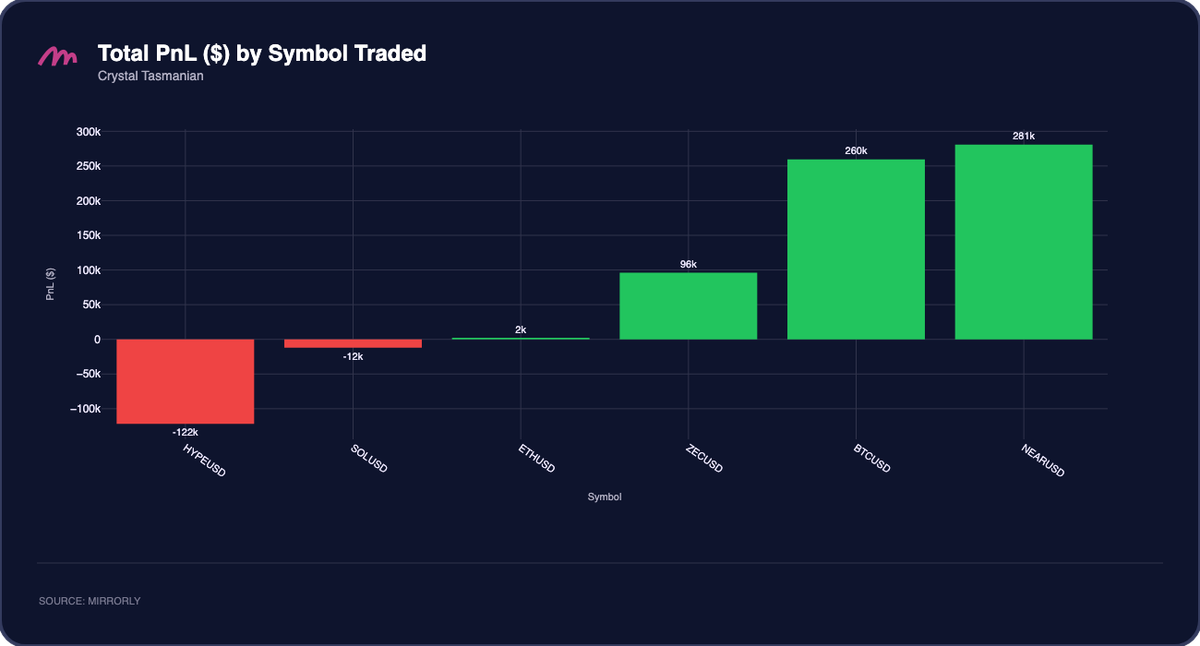
$NEAR led at about +$281K, almost all from that one short, followed by $BTC at +$260K and $ZEC at +$96K. $NEAR and $BTC together contributed about $541K, roughly 107% of the monthly total. $HYPE was the main drag at -$122K, a reversal from May, when it produced about $2.5M of his $2.59M. $SOL cost a further -$12K, and $ETH was flat at +$2K. Combined losses of about $134K absorbed roughly 21% of gross gains, the highest share of the three.
PnL Distribution#
Crystal Tasmanian's median closed position was exactly $0, consistent with a win rate just above 50%, and his winning tail is longer than his losing one. The 69 positions inside the P1 to P99 range (+$218K and -$123K) produced +$378K, about 75% of the monthly total. The two outside it netted +$127K: the $NEAR short near +$281K and the $BTC short near -$154K. Inside the range, his best winners, between about +$128K and +$192K, were larger than his worst losses near -$105K to -$110K. Those larger winners lifted a 50.7% win rate to a profit factor of 1.49.
Case Study - Inside RTB2's Exits: Three September Longs Closed Before the Decline#
RTB2 built his month on three long positions he opened in September and closed in the first week of October, a few days before the majors turned lower. To see how he managed them, we rebuilt each position from his Hyperliquid fills on a 1-hour basis. The charts below show the entries and exits on price, the size of the position, and its running PnL. All times are UTC.
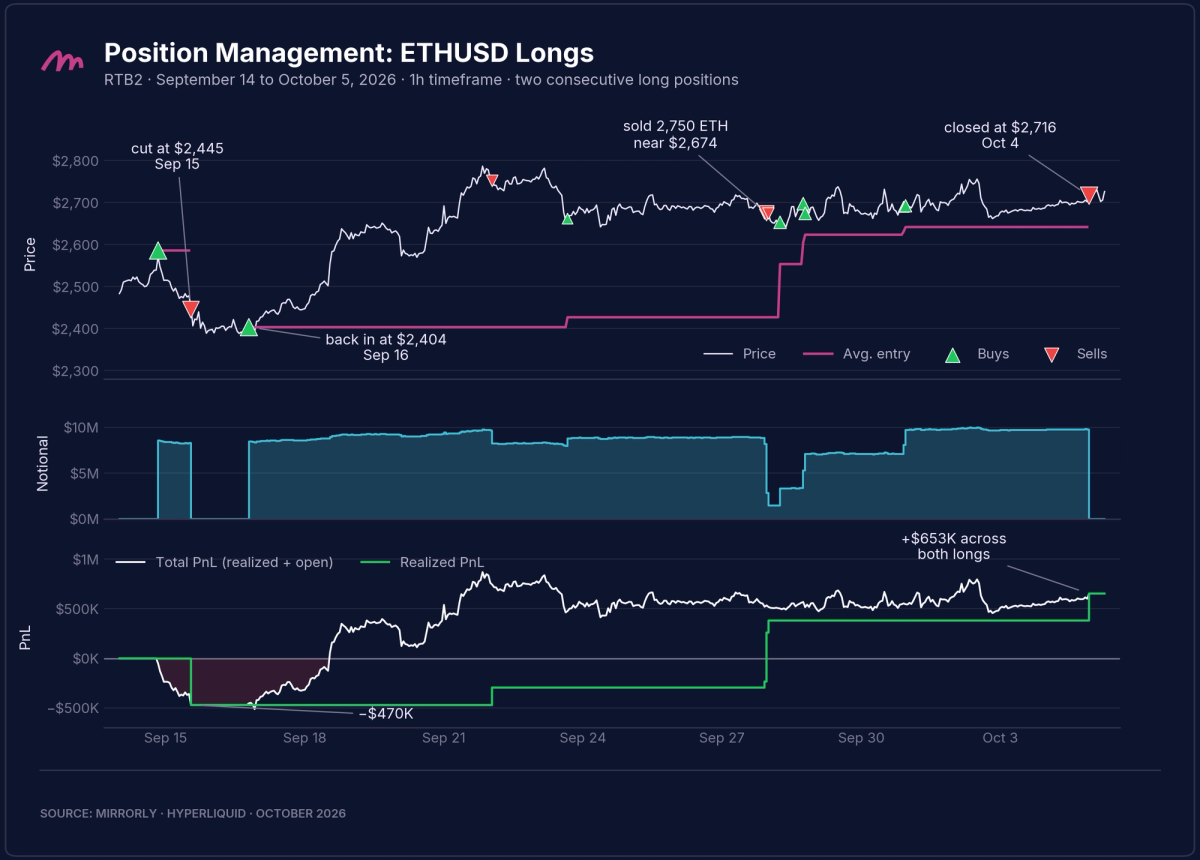
The $ETH long started with a loss. On September 14 at 20:00 he bought about 3,336 $ETH at an average of $2,586, roughly $8.6M of notional. $ETH fell through the next morning, and 17 hours later he closed the whole position at $2,445 for -$470K. That loss closed in September, so it does not appear in his October statistics. $ETH bottomed near $2,357 about five hours after his exit. On September 16 at 19:00 he bought back 3,500 $ETH at $2,404, about 2% above the low and 1.7% below the price where he had sold. This second position was never more than about $45K underwater.
He then sold into strength in steps. With $ETH near its September high of $2,810, he sold 500 $ETH at $2,752 on September 22 for +$174K, and on September 27 and 28 he sold another 2,750 at about $2,674 for +$680K. He rebuilt the position the same day and added again on September 30, buying about 3,070 $ETH at an average of $2,680. That took him to 3,619 $ETH, about $9.6M, at an average entry of $2,642. On October 4 at 22:00 he closed all of it at $2,716, 2.3% below $ETH's October high of $2,779 on October 2, for a final +$270K. The second long made +$1.12M in total, $854K of it realized in September, and together the two longs netted +$653K. $ETH finished October near $2,255, about 17% below his exit.
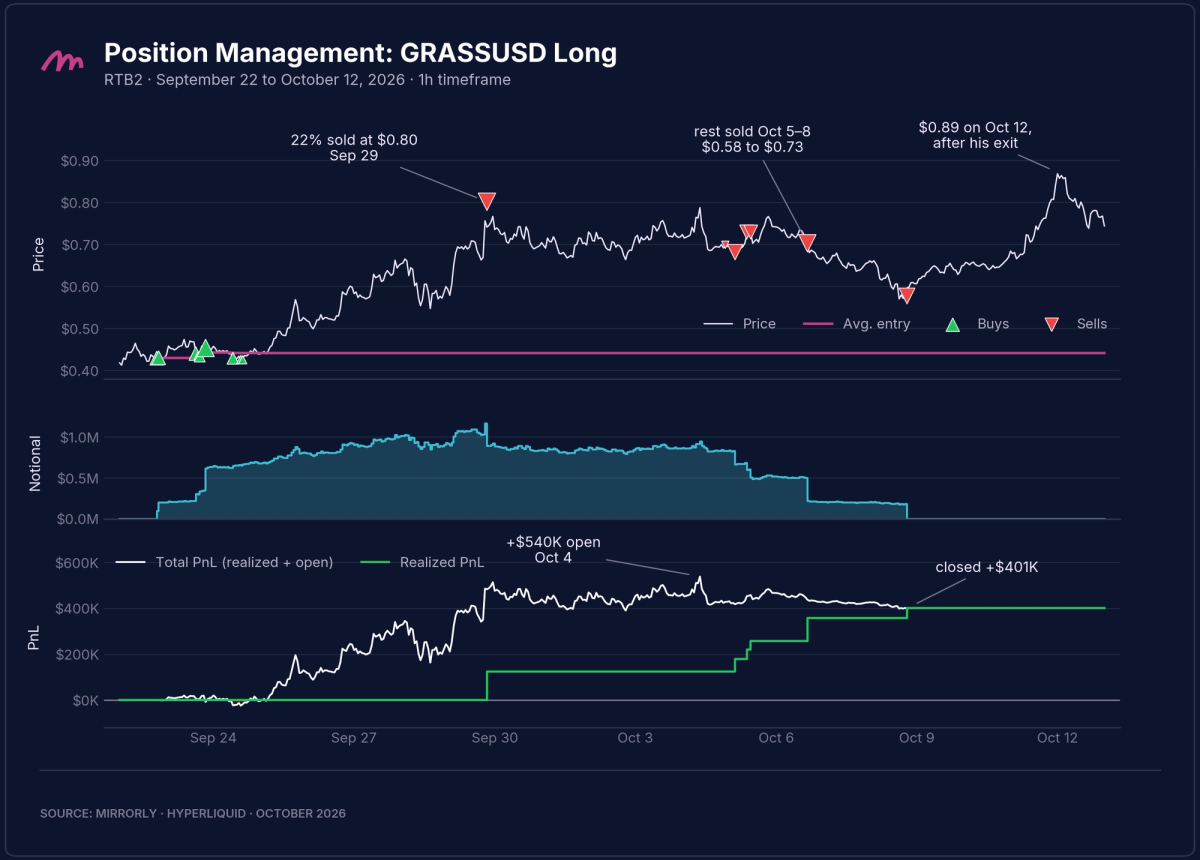
He scaled into $GRASS low and out in stages. Between September 22 and 24 he bought about 1.55M $GRASS at an average of $0.442, a position that cost about $683K. The token nearly doubled over the following week. On September 29 at 20:00 he sold 22% of the position at $0.80, within about 2% of the September high of $0.821, for +$125K. He held the rest while $GRASS traded between roughly $0.67 and $0.79, with open profit peaking near +$540K on October 4, and then sold it between October 5 and 8 at prices from $0.73 down to $0.58. The position closed at +$401K, a 59% return on its cost and about 74% of its peak open profit. $GRASS rallied to $0.89 on October 12, above any of his exit prices, before ending the month near $0.58.
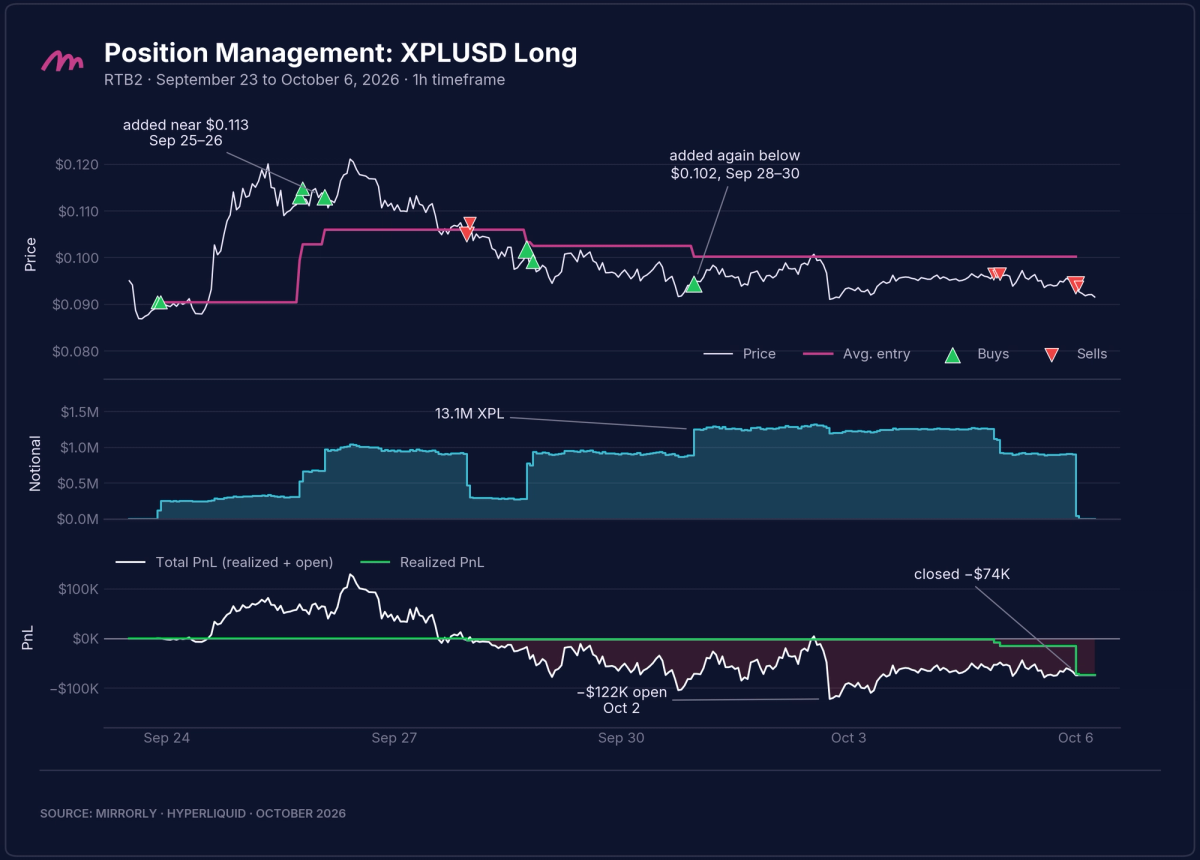
The $XPL long was the exception. It produced his only loss of the month and the 12-day average losing holding period in his key metrics. He opened it on September 23 with 2.76M $XPL at $0.090 and added 5.8M more on September 25 and 26 at $0.113 to $0.115, close to the local top. As the price fell back he trimmed the position on September 27 and 28 at roughly breakeven, then bought again: 6.6M $XPL near $0.100 on September 28 and 3.7M at $0.094 on September 30. That took him to 13.1M $XPL, about $1.3M of notional, at an average entry of $0.100. The open loss reached -$122K on October 2, and he sold the position between October 4 and 6 at $0.094 to $0.097 for -$74K. On $ETH he cut an $8.6M loser within 17 hours. On $XPL he added to a smaller losing position twice and held it for 12 days.
On October 4 at 22:00 he sold the entire $ETH position and started selling $GRASS and $XPL in the same hour, and all three were closed by October 8, as $ETH and $SOL began a decline that took them down 17% and 19% for the month. If he had held the $ETH long to the end of October, the drop from $2,716 to $2,255 would have cost him about $1.67M at that size, more than the position earned.
RTB2's October statistics (an 87.5% win rate and a profit factor of 20.81) start after his worst trade. The -$470K $ETH loss closed on September 15, so if you copied him from September 14, you netted $653K on $ETH, not $1.12M. His exits earned as much as his entries: he sold $ETH in stages into the rally and closed the whole book within a few days of the top. To copy RTB2 you have to follow his sells as closely as his buys, at a position size of $8M to $10M in $ETH.
Conclusion#
October's falling market produced three different routes to the top of the leaderboard. RTB2 made +$1.47M from 8 positions, booked most of it in September, and closed his long book between October 4 and 8, before $ETH and $SOL fell 17% and 19% for the month. Cool Russell ran a two-sided book that leaned short and earned +$1.26M across 286 positions, with $BTC and $ETH contributing 57% and his largest pullback after October 7 at about $200K. Crystal Tasmanian started the month long, traded short from October 8, and finished at +$505K, with one $NEAR short worth +$281K covering a -$122K loss on $HYPE.
The case study shows what a calendar month can leave out. RTB2's 87.5% win rate and 20.81 profit factor exclude his worst trade, a -$470K $ETH loss he closed on September 15. If you had copied him from September 14, his two $ETH longs would have netted you $653K, not $1.12M. He made the rest of his edge on the way out, selling $ETH into the rally in steps and closing the whole book two days after the $ETH high.
Join Mirrorly: https://portal.mirrorly.xyz/
Subscribe to our Notifications so you don't miss next month's report!