Featuring curated, consistently profitable traders from the Binance Leaderboard.
We'll reveal key stats and insights that distinguish top traders in this competitive arena.
Let's explore the trading elites! 💪
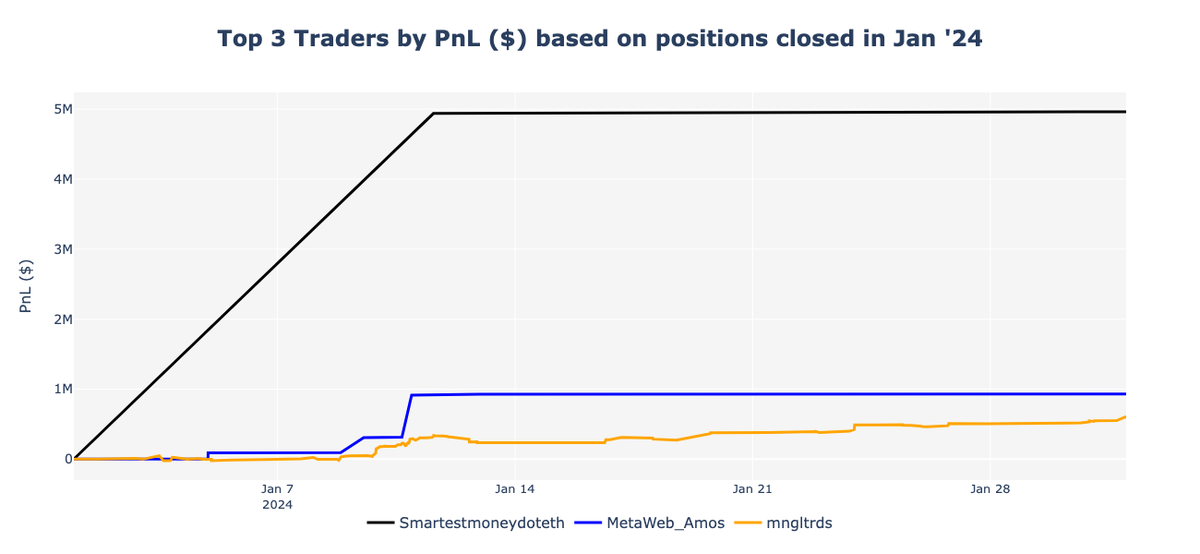
1️⃣ Top 3 Traders by PnL ($) - Overview#
January 2024 unveils its elite trio of trading maestros as follows:
🥉 mngltrds
January marked a significant milestone with the highly anticipated approval of the BTC spot ETF, culminating in four consecutive months of gains before transitioning into a period of heightened volatility with fluctuations in both directions.
Despite this, from the moment the BTC spot ETF was introduced on January 11th, BTC witnessed a notable decline, shedding approximately 21% from its monthly peak to its trough.
Amidst these challenging market conditions, the top three traders we've spotlighted this month demonstrated exceptional skill, securing profits ranging from $600k to an impressive $5 million.
As anticipated in our last report, taking the lead this month is still Smartestmoneydoteth, who astoundingly turned his MKR position into a $5 million realized profit. This was a position expertly managed over nearly five months.
Stepping into the spotlight for the first time to claim the second and third positions are two newcomers: MetaWeb_Amos and mngltrds.
MetaWeb_Amos clinched the second spot, boasting a remarkable profit of $929k alongside an impressive win rate of 92.86%. Snagging third place is mngltrds, with profit of $599k.
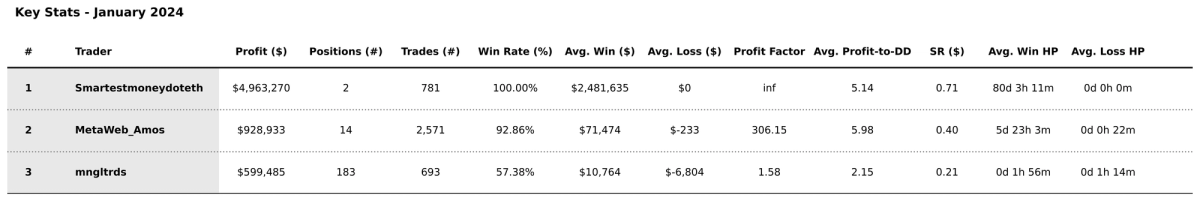
2️⃣ Top 3 Traders - Performance Metrics and Profiles#
This month's analysis of the key performance metrics for the top three traders again reveals significant variations in their trading styles.
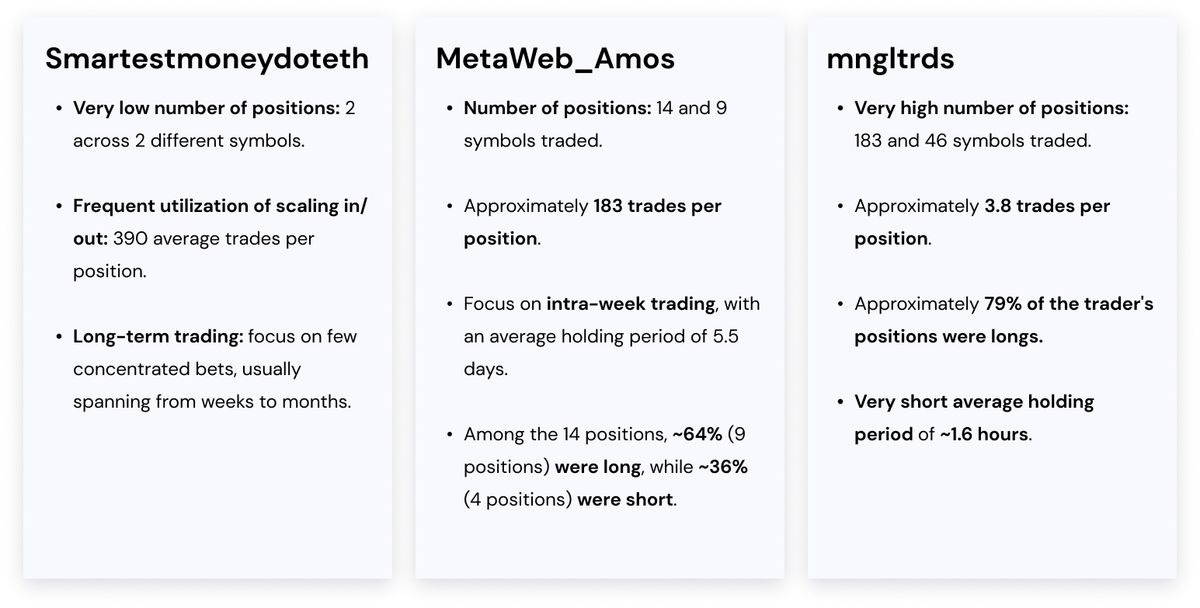
Smartestmoneydoteth tends to open a limited number of concentrated bets, maintaining them for durations ranging from weeks to months.
MetaWeb_Amos, on the other hand, engages in intra-week trading, achieving a high win rate of 92.9% along with an impressive Average-To-Drawdown ratio of 5.98. This indicates that, on average, his profits on successful trades were nearly six times higher than the maximum drawdown experienced in those positions.
Meanwhile, mngltrds adopts a strategy of much higher frequency trading, with an average position holding time of 1-2 hours. mngltrds achieves a solid profit factor of 1.58 and an Average-To-Drawdown ratio of 2.15, remarkable figures especially considering they were achieved across 183 positions.
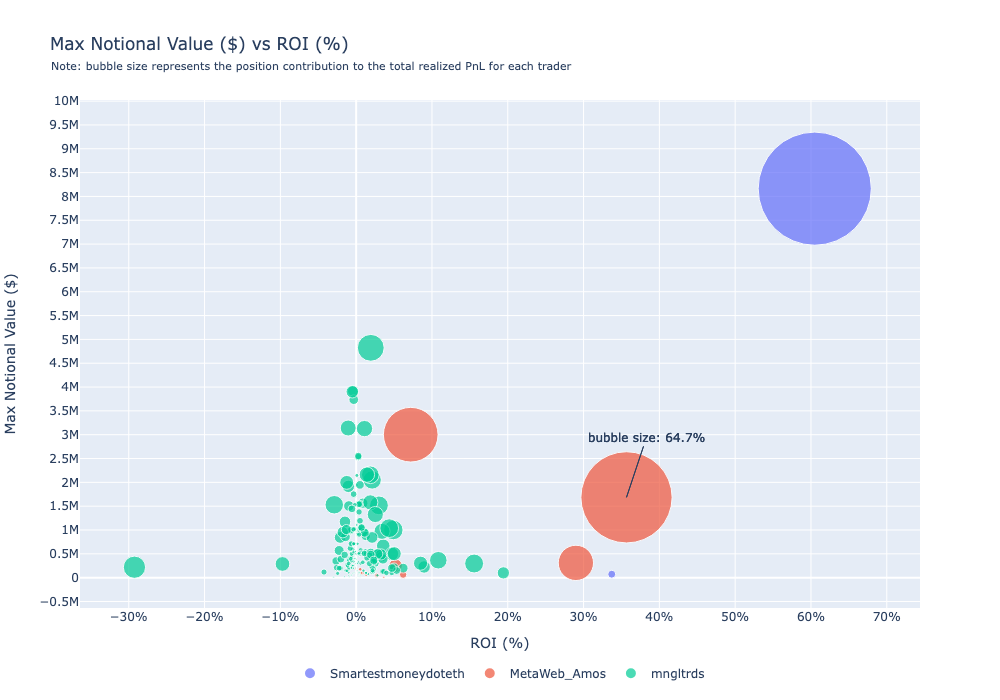
The figure below displays a bubble chart comparing the maximum notional value ($) and ROI (%) for each trader's positions. The size of each bubble indicates the contribution of that position to the trader's total realized PnL. For instance, one of MetaWeb_Amos's positions, as highlighted, had a maximum notional value of approximately $1.7mln, a 36% ROI, and contributed 64.7% to his total PnL.
This chart can help us gain insights into the position management and risk/return profiles of each trader.
For MetaWeb_Amos, it's noteworthy that his top three positions, out of 14 closed during the month, accounted for approximately 97.6% ($907k) of his total profits ($928k). This highlights a strategy reliant on a few significant victories that constitute nearly all of his realized gains.
Conversely, mngltrds employs a strategy that involves significant variation in the notional value invested, yet achieves a relatively consistent ROI (%), with occasional outliers both positive and negative. The contribution of his profits per trade demonstrates a remarkably steady range from 0.08% to 0.6%, indicating that the variance in his equity curve is minimal and his total profits are the cumulative result of numerous trades, rather than being dominated by just a few.
As mentioned in last month's report as well, for Smartestmoneydoteth, the chart offers limited insights due to the scarcity of data points.
The figure below provides a summary of their main profiles:
3️⃣ Trader Spotlight: Smartestmoneydoteth#
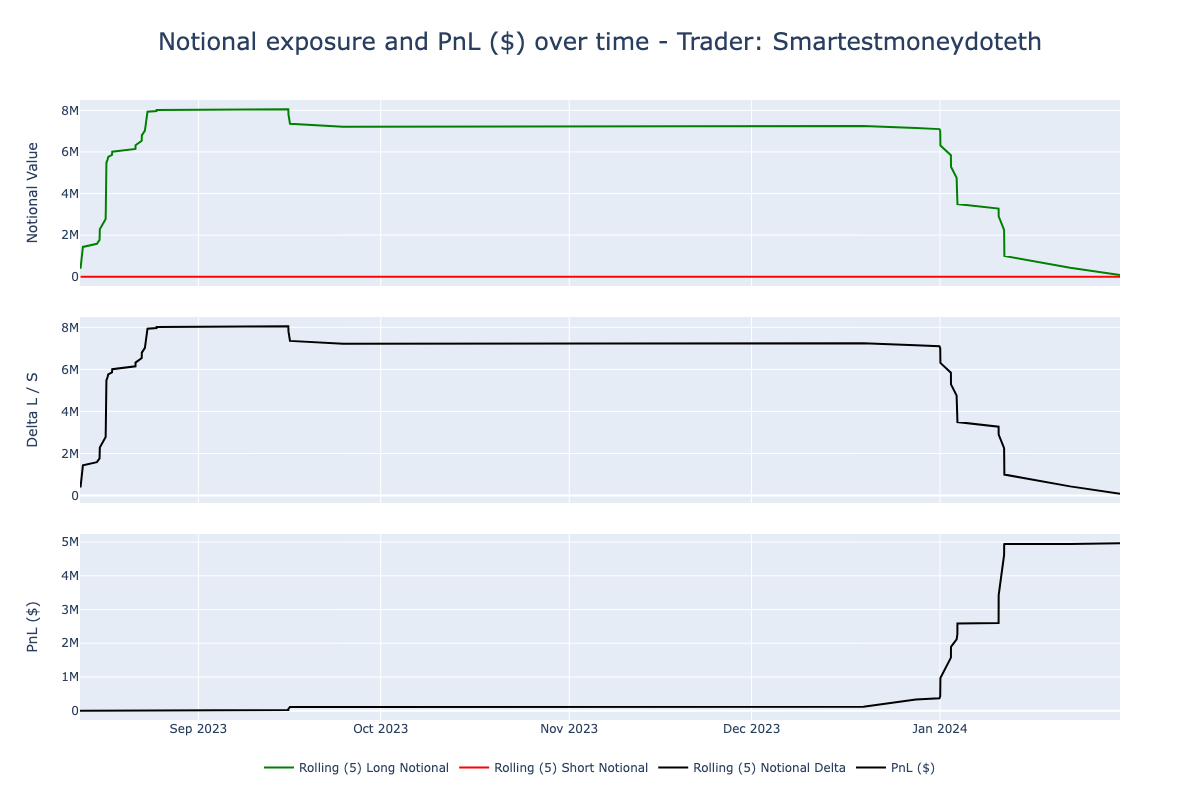
3.1. Notional exposure and PnL ($)#
In January 2024, Smartestmoneydoteth concluded the month with realized profits of approximately $5 million.
During this period, he settled two positions, MKRUSDT and MAVUSDT, with MKRUSDT being the primary focus. This position, initiated in mid-August and concluded in early January, saw a maximum notional exposure exceeding $8 million, as illustrated in the image below.
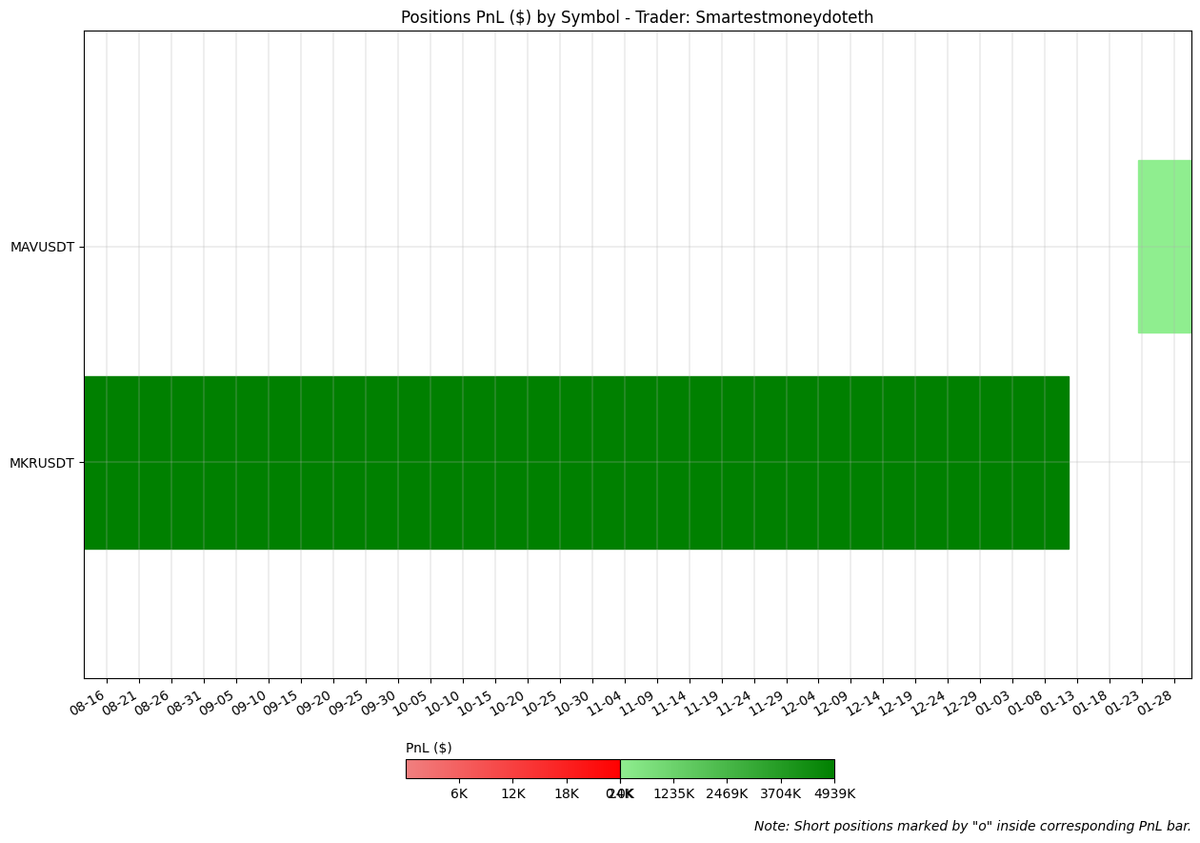
The figure below displays, for each closed position in January ‘24, the PnL ($) by symbol traded and their holding period:
3.2. Position Case Studies
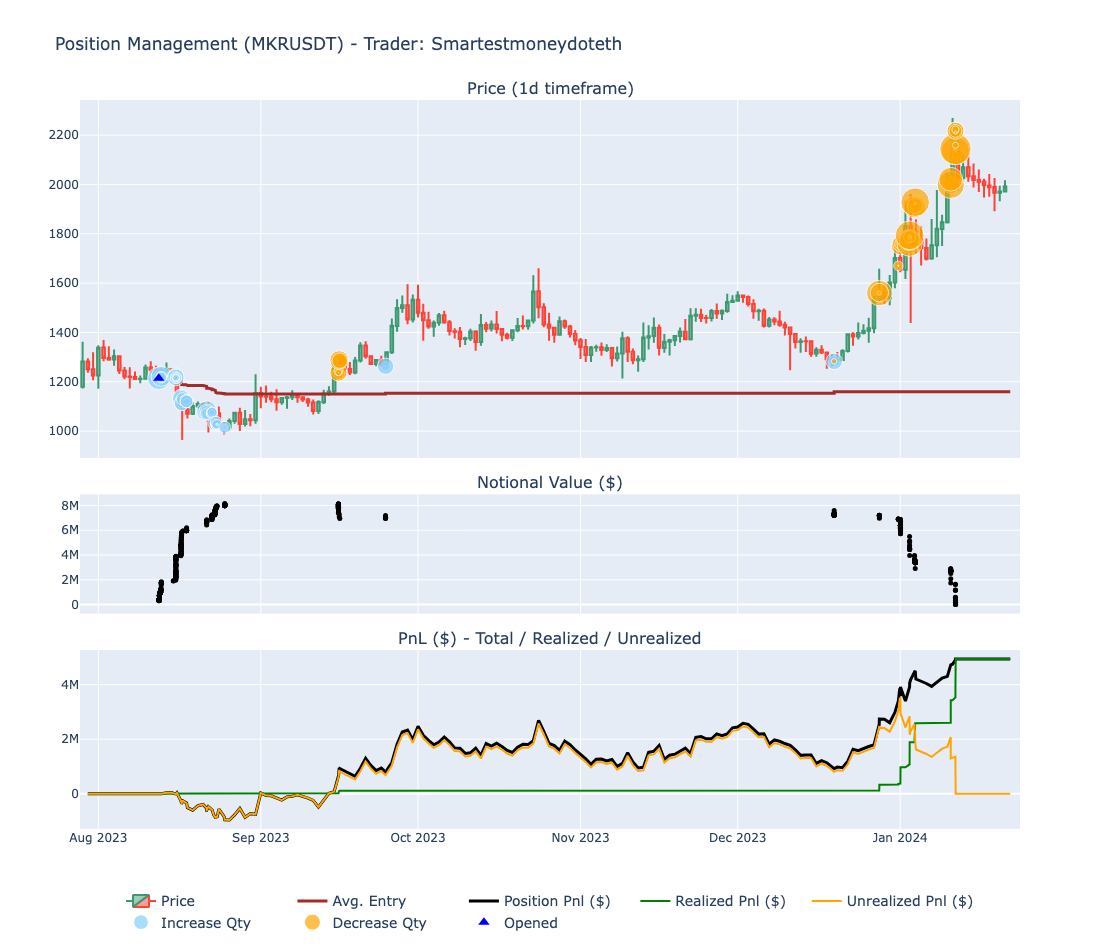
MKRUSDT - The Trade That Earned $5 Million#
Trade Info:
- Side: Long
- Trades executed: 778
- Max DD ($): -$965k
- Final Pnl ($): $4.9M
- ROI (%): 60.5%
- Holding Period: ~5 months
Smartestmoneydoteth initiated his MKR position on August 12th, capitalizing on a multi-month breakout accompanied by robust volume. He closed it on January 11th after a huge pump and near a huge resistance level.
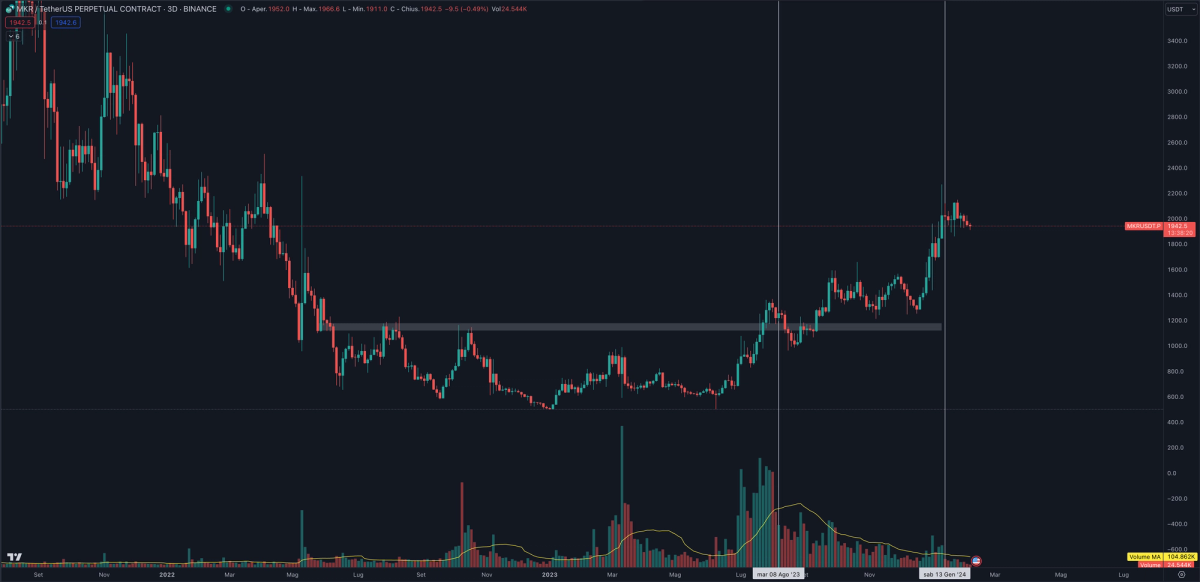
Between August 12th and 15th, he established a starting position worth approximately $4 million at an average entry price of around $1218.
When the price declined to the $1100-$1150 range, he increased his investment by $2 million, adjusting his total investment to about $6 million and lowering his average entry price to $1190.
As the price further decreased to around $1000, he added another $2 million, bringing his total investment to roughly $8 million with an average entry price of $1150. At this stage, with the price having fallen more than 17% from his initial entry, the position faced its maximum drawdown of $965k, or approximately -12% of the $8 million investment.
It's important to contextualize these significant figures within the scope of each trader's portfolio size. Smartestmoneydoteth's disclosed wallet balance exceeds $29 million (last DeBank figures), not accounting for assets on exchanges or in other wallets. Thus, a $965k loss represents about 3.3% of his portfolio—a manageable setback over a long-term investment.
Reflecting on the critical role of risk management, here are Smartestmoneydoteth's insights on the subject (ref: https://x.com/smartestmoney_/status/1755518732787650851?s=20):
“[...]Regardless, my main objective here is to teach you how to fish byprioritizing overall portfolio risk management above all else*.
First step to that is to* always think in terms of Rs (Risk/Reward). When looking for location of entries, you shouldALWAYS optimize for the most asymmetric bets*.
Define your risks as per my past 2 trades where i’m risking 2 cents to make 9-15 cents.
***Entries are a science.You have to be surgical with them andsize the trade and potential losses in relation to % of your portfolio.Once you think about how to manage risk and potential losses EVERYTHING else will fall into place.”
As the trade progressed, despite an initial setback, the price began to rise, stabilizing between $1050 and $1500 for about 3.5 months.
This period of patience and conviction was rewarded when MKR's price started its breakout on December 27th, swiftly climbing from $1500 to $2200. Smartestmoneydoteth strategically secured profits during this ascent, ultimately closing the position on January 11th with a final profit of $4.9 million.
Notably, the final Profit-to-Drawdown ratio, with a profit of $4.9 million against a drawdown of $965k, stands out as a commendable 5x, underscoring the effectiveness of his risk management and investment strategy.
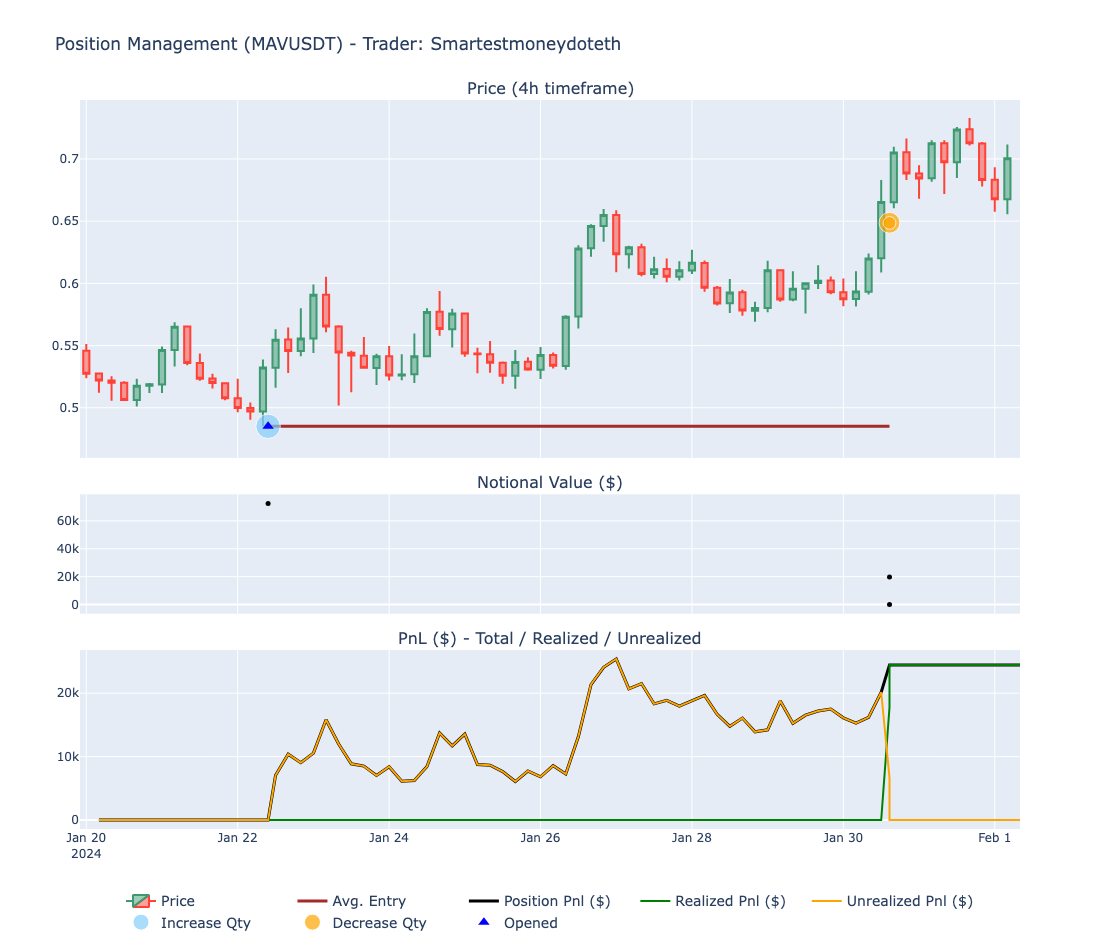
MAVUSDT - The End of Live Sharing Trades#
In recent months, as his following on Twitter and Telegram channels expanded, numerous traders began to mimic his trading moves.
This was especially evident with the MAVUSDT trade, where he was front-runned by copy traders as soon as he started accumulating MAV.
Copy traders caused an immediate 20% surge in price that prevented Smartestmoneydoteth from fully establishing his intended position, forcing him to exit the trade prematurely.
This experience prompted Smartestmoneydoteth to change his approach to execution, this has enabled him to keep sharing position information to us who are interested in analysing his superb performance.
Despite this change, he continues to offer value through delayed updates on his trades and remains accessible for discussions about his investment philosophy, maintaining a connection with his followers while prioritizing his trading efficacy.
4️⃣ Trader Spotlight: MetaWeb_Amos#
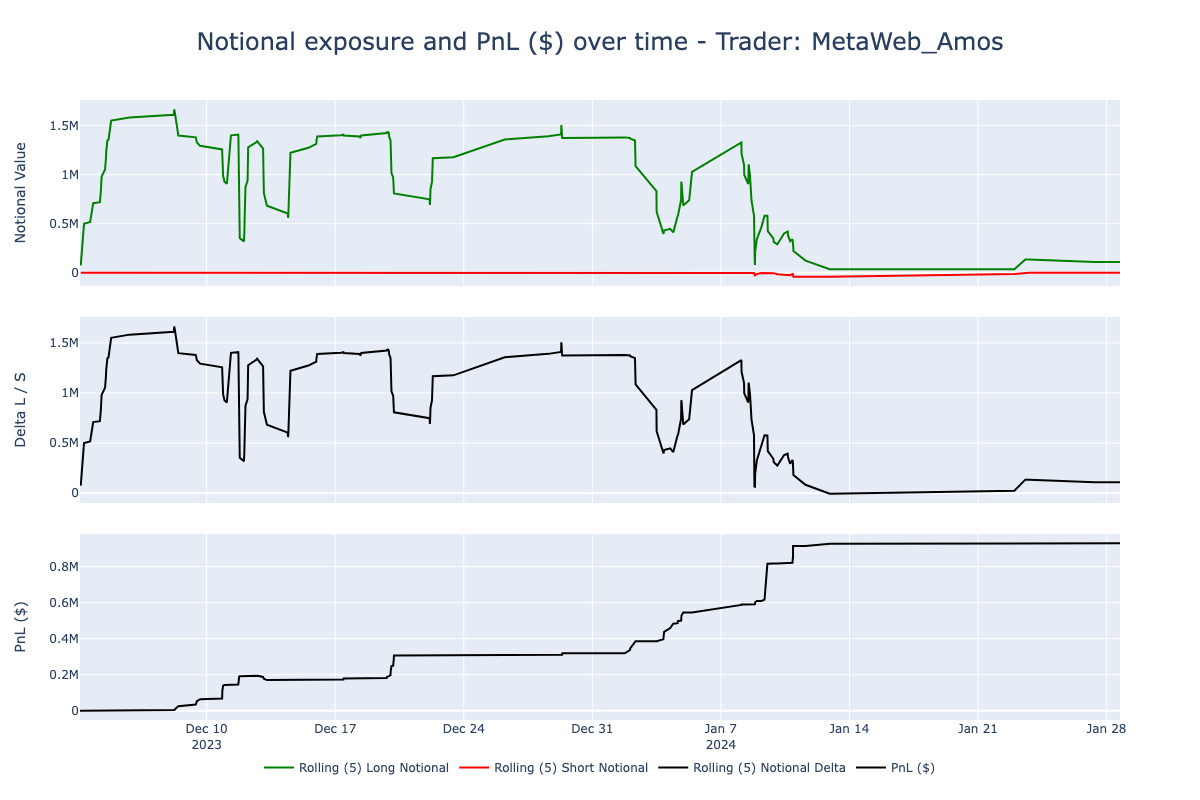
4.1. Notional exposure and PnL ($)#
MetaWeb_Amos's trading strategy seems to focus on intra-week trades, with his three most significant trades contributing to nearly 97.6% ($907k) of his overall earnings ($928k).
His investment levels varied, mostly between $0.5 million and $1.5 million. Notably, he optimized his long positions throughout December and scaled them back following the launch of the BTC spot ETF on January 10th.
The PnL trajectory for MetaWeb_Amos is notably upward and to the right, showcasing minimal drawdowns allowing him to close the month with a profit of $928k.
The figure below displays, for each closed position in January ‘24, the PnL ($) by symbol traded and their holding period:
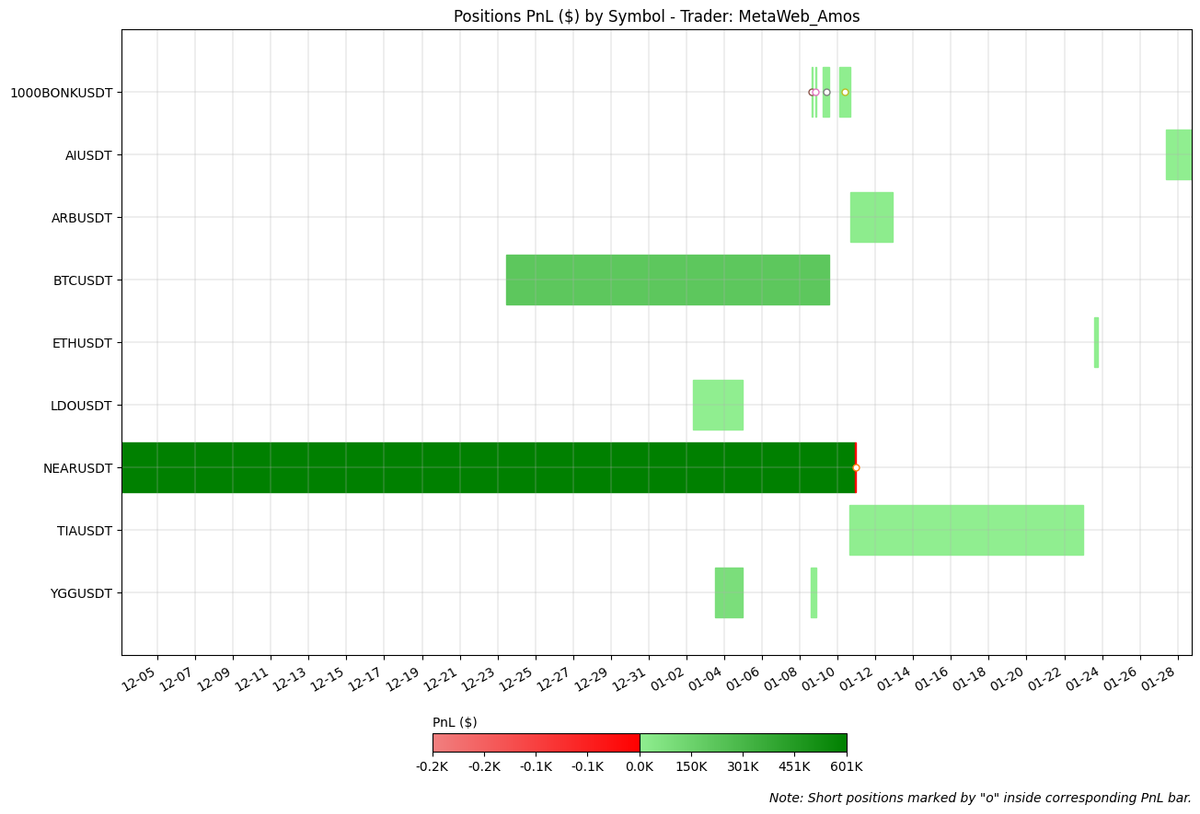
4.2. Position Case Studies#
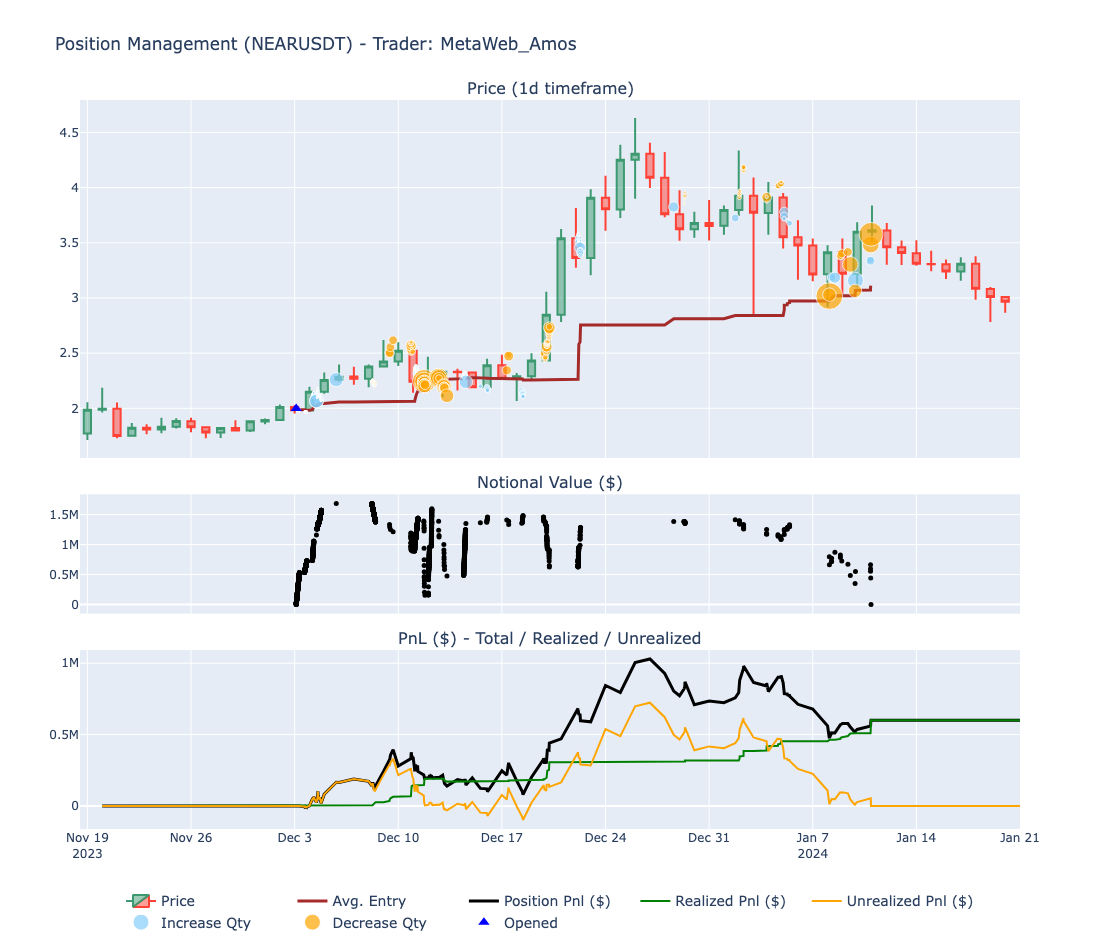
NEARUSDT - A Single Trade Accounting for 65% of Total PnL#
Opened Dec 3th ‘23 | Closed Jan 10th ‘24:
- Side: Long
- Trades executed: 2498
- Max DD ($): -$9.8k
- Final Pnl ($):$601k
- ROI (%): 35.7%
- Holding Period: ~39 days
MetaWeb_Amos initiated his position at the start of December 2023, actively adjusting his stake several times, reaching a peak notional value of approximately $1.5 million.
He concluded this trade on the day the BTC spot ETF was approved, securing a profit of $601k, which represented around 65% of his overall PnL ($929k). It's also important to highlight the remarkable Profit-To-Drawdown (P/DD) ratio of 61.3; in general, across the 14 positions he closed this month, he achieved an average Profit-to-Drawdown ratio of 5.98, highlighting the essential importance of risk/reward management in sustaining long-term profitability.
The trade commenced shortly after the NEAR price flipped S/R zone and stabilized within this area for a few days, preceding a significant upward movement that lasted a month, with the price escalating from $1.8 to a high of $4.6.
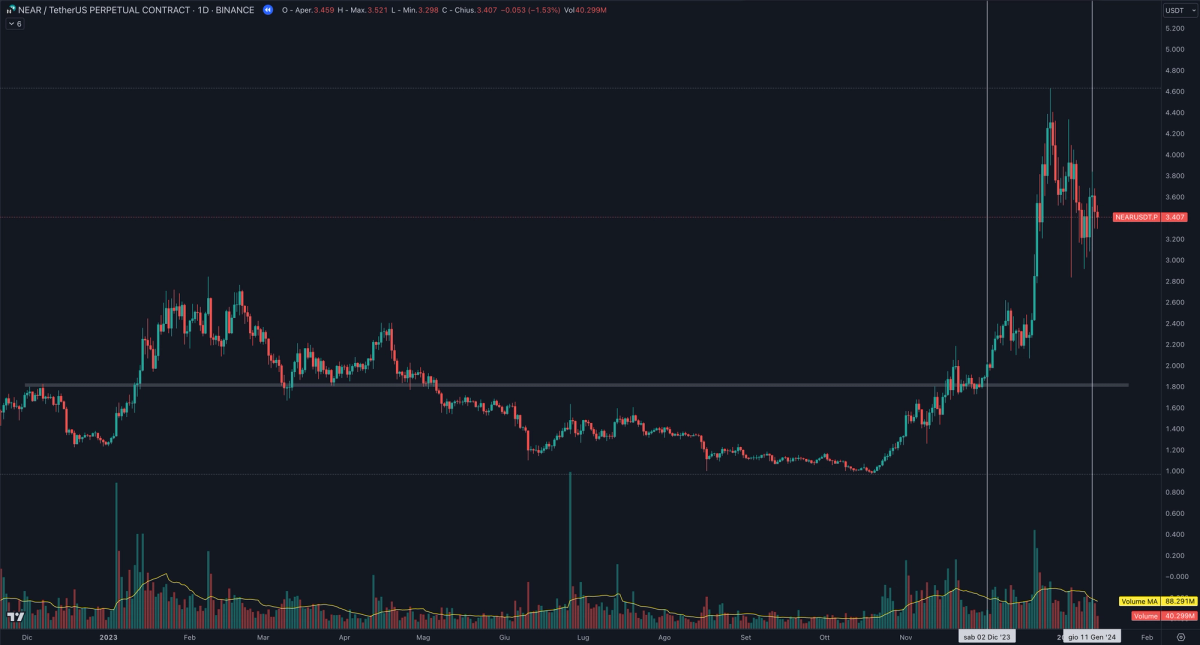
Below the details and position management of the trade:
5️⃣ Trader Spotlight: mngltrds#
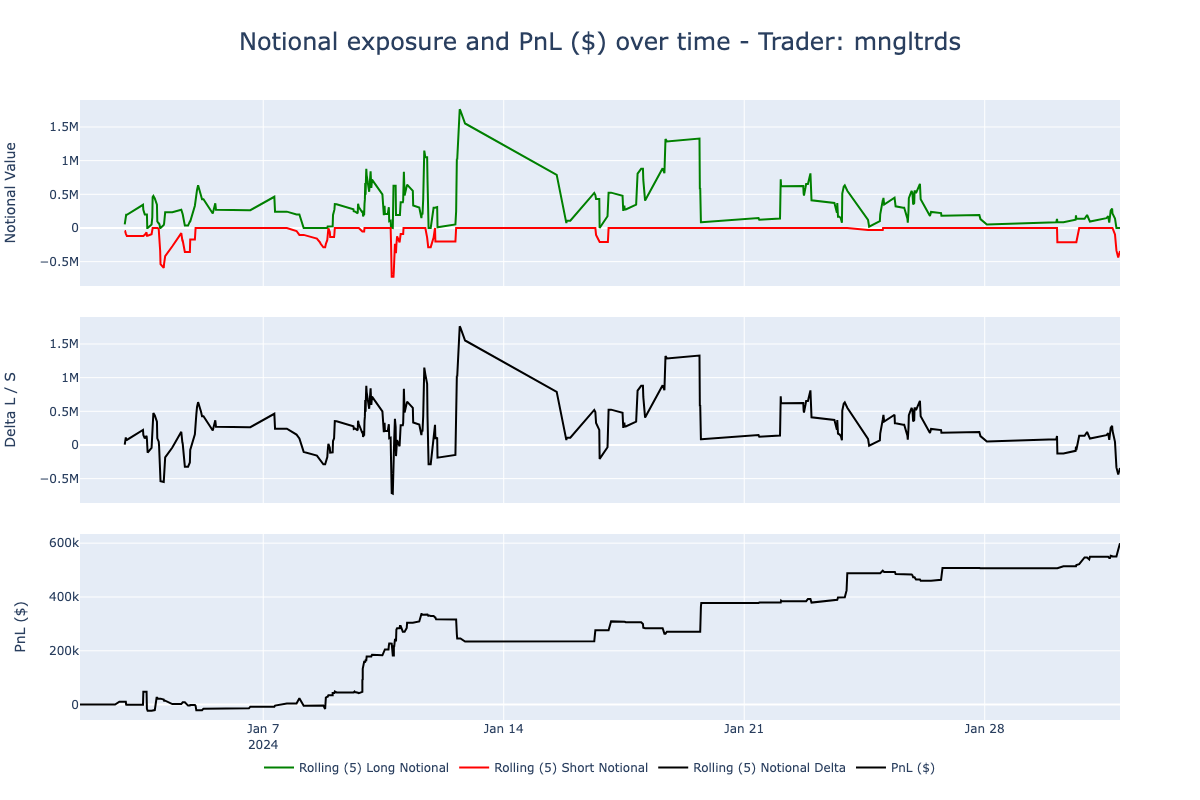
5.1. Notional exposure and PnL ($)#
In January 2024, mngltrds successfully closed 183 positions, maintaining an average holding time of merely 1-2 hours.
He engaged in both long (64%) and short (36%) positions, with his investment size varying between $0.5 million and $1.5 million.
He traded a total of 23 symbols, focusing on mid to low-cap and newly released coins, likely shifting his attention in line with the hot narratives of the moment.
His performance metrics are strong, with a Profit Factor of 1.58, an average Profit-to-Drawdown ratio of 2.15, and a Win Rate of 57.4%.
All these metrics contributed to a consistent PnL curve, enabling him to secure a profit of $599k.
The figure below displays, for each closed position in January ‘24, the PnL ($) by symbol traded and their holding period:
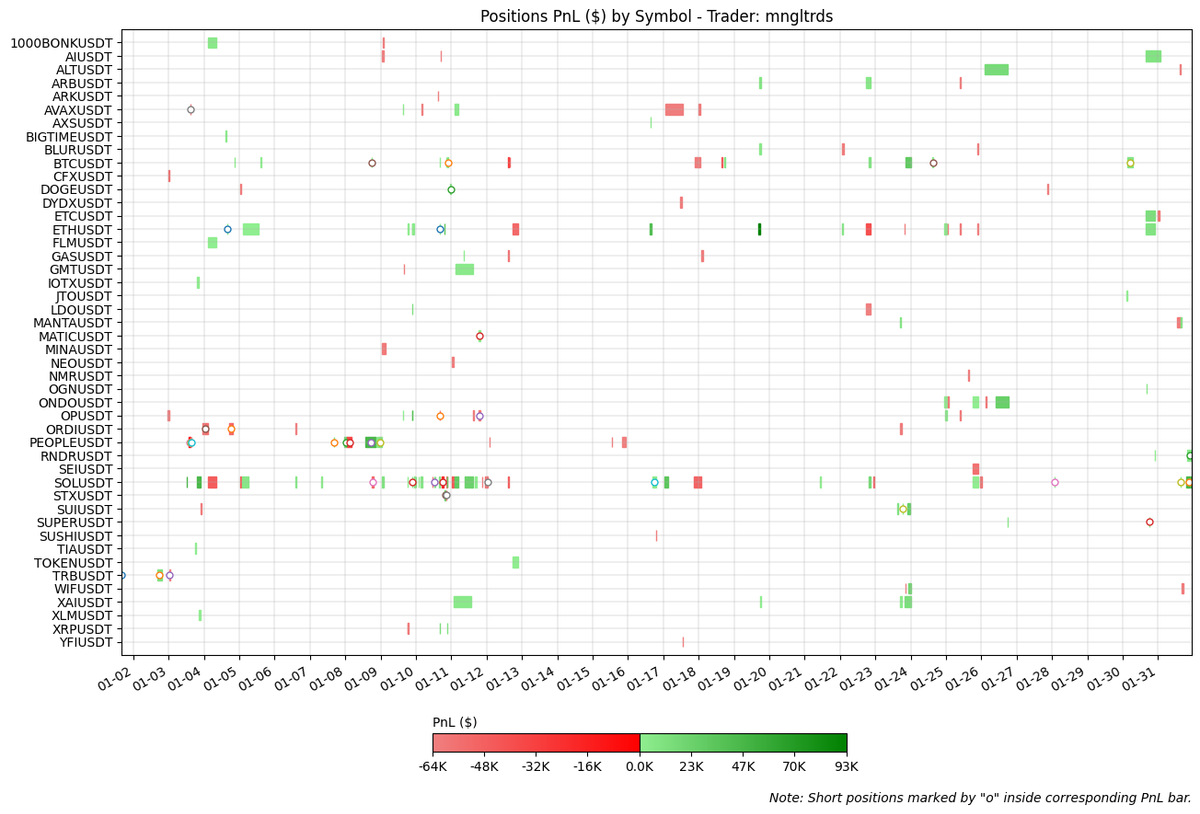
The cumulative distribution function (CdF) of his PnL is positively skewed (skewness: 1.12), with a positive edge since lower percentiles:
- 25th percentile: W/L ratio of 1.08 ($1.4k vs $-1.3k)
- 75th percentile: W/L ratio of 1,65 ($12.4k vs $-7.5k) 5.2. Position Case StudiesSOLUSDT - The liquidation trade Win trade: The SOLUSDT transaction was a swift move by mngltrds during the January 3rd liquidation event, enabling him to secure a $49k profit in just 12 minutes, achieving a 4.9% ROI from a $1.5 million notional amount. This trade was among his most significant, contributing approximately 3% to his overall PnL. He entered the position shortly after the appearance of a hammer candlestick, which, after dipping to a low around $85, rebounded to close at $93. He then exited the trade minutes later upon reaching the first short-term resistance level. Below the details and position management of the trades executed: ETHUSDT - The reversal play Lose trade: In the ETHUSDT position, mngltrds likely anticipated an upward reversal following a period of price consolidation and the formation of lower highs. He initiated the trade at approximately $2375, committing a notional value of $2 million. However, the price began to decline shortly after his entry. He faced a maximum drawdown of about $50k and, when the price recovered slightly to the $2350 range, mngltrds exited the trade, incurring a loss of roughly $25k. This trade accounted for about 1.5% of his overall PnL. Below the details and position management of the trades executed: 6️⃣ Conclusion Keep an eye out for our next report, where we will explore these trends and other developments in greater depth. Stay connected for more insights in the upcoming month's edition.
- Side: Long
- Trades executed: 3
- Max DD ($): $0k
- Final Pnl ($): +$49k
- ROI (%): +4.9%
- Holding Period: ~12 minutes
- Side: Long
- Trades executed: 3
- Max DD ($): -$50.4k
- Final Pnl ($): -$24.9k
- ROI (%): -1.25%
- Holding Period: ~3 hours
- "Once you think about how to manage risk and potential losses EVERYTHING else will fall into place" suggests Smartestmoneydoteth, emphasizing that effective risk management is crucial for sustained profitability and minimizing the risk of financial ruin. Even with the best trading system / strategy, poor risk control can lead to total losses.
- Despite varying trading approaches, all top traders share a commonality: they exhibit a positive skew in their returns (so, there are a few instances of very high returns compared to the left side, where losses are more confined) along with a Profit Factor and an average Profit-to-Drawdown ratio exceeding 1. This indicates their focus on favorable risk/reward ratios across their trades, providing them with a strategic advantage to incrementally increase their portfolio over time.
- Follow our highlight traders on Twitter: Smartestmoneydoteth https://twitter.com/smartestmoney_ MetaWeb_Amos let us know if he has a twitter account mngltrds let us know if he has a twitter account
- Data analysis provided by@0xfab_eth. Drop him a follow!
- BETA ACCESS:https://portal.mirrorly.xyz/beta-application?referralCode=0xfab Subscribe to our Notifications so you don't miss next month's report!